Introduction
Aging creates substantial added value for low-grade raw beef and non-preferred cuts such as Grade 2 or 3 raw beef, thereby improving tenderness, flavor, and texture to match those of high-grade raw beef (Dashdorj et al., 2016). Aging techniques can be divided into dry and wet ones (Garlough and Campbell, 2012). Dry aging features a low yield but results in a large price increase and is therefore often applied to beef (most commonly to ribeye, strip loin, round, and top sirloin butt).
Although research into aged beef is prolific (Aroeira et al., 2016; Iida et al., 2016; Kim et al., 2017; Savell, 2008), previous studies have been limited to observing changes in aged beef either in the laboratory or under particular aging conditions, while only few studies have analyzed factors that determine aging.
Dry aged beef manufacturers employ proprietary manufacturing methods based on temperature and humidity; thus, aging methods vary by manufacturer, which results in inconsistency in aged beef production. In addition, no standard methods or criteria have been established by the Korean Food Code, Korean Standards, or international standards (CODEX and ISO). In this context, it is necessary to identify factors that distinguish fresh beef from aged beef regardless of the manufacturing method by observing quality changes during beef aging. Therefore, the purpose of this study was to: (i) analyze the effects of time on the quality changes of currently available aged beef sourced from three Korean manufacturers and (ii) identify quality indicators that distinguish fresh beef from dry aged beef regardless of the manufacturer.
Materials and Methods
The physical and physiological changes in dry aged beef were determined for samples collected from three different companies (A, B, and C) in Korea. Cattle from company A was Grade 1 Hanwoo, whereas those from companies B and C were Grade 3 Holstein. Aging temperature was 4±2°C in A, B, and C companies, but other aging conditions (humidity and air conditions) were differ from companies. For the experiment, loins were selected from each carcass, with each sample weighing 2–3 kg. The samples were aged for 63 days. On day 0, 7, 14, 21, 28, 42, and 63, dry aged samples from each company were transported to the laboratory at 4°C-10°C within 2 h.
Sample storage, trimming, and aging losses were calculated as follows:
Measurements were performed on minced dry aged samples (200 g) using a Food ScanTM Meat analyzer (Foss, Denmark).
Samples of minced dry aged beef (5 g) were mixed with 20 mL of distilled water and homogenized using an ULTRA-TURRAX device (Model No. T25, Janken & Kunkel, Staufen, Germany) at 8,000 rpm for 1 min. A pH meter (Model 340, Mettler-Toledo, Greifensee, Switzerland), calibrated with pH 4.0 and 7.0 buffers, was used to measure sample pH.
Water holding capacity was measured using the method of Grau and Hamm (1953) with minor modifications. Typically, a 300-mg sample was put on filter paper (Whatman No. 2), which was then placed between plexiglass plates and pressed for 3 min. Sample area before and after pressing was measured with a planimeter (Type KP-21, Danfoss, Nordborg, Denmark), and water holding capacity was then calculated as follows:
A 200-g sample was sliced into steaks measuring 50 mm (width) × 40 mm (length) × 20 mm (height), which were heated until the steak center reached 70°C and then immediately cooled to 4°C. The cooking yield was calculated as follows:
Samples placed in a polyethylene bag were heated to 80°C for 30 min and then cooled at room temperature for 30 min. For shear force and texture profile analysis, samples were cut to dimensions of 40 mm (width) × 10 mm (length) × 10 mm (height) and 25 mm (width) × 25 mm (length) × 25 mm (height), respectively. Shear force was measured using a texture analyzer (TA-XT2i, Stable Micro Systems, Surrey, UK) with a V Blade set (Warner-Bratzler V blade) at a cross head speed of 5 mm/s. The texture profile was also measured using a texture analyzer (TA-XT2i) at a pre-test speed of 2.0 mm/s, a post-test speed of 5.0 mm/s, a maximum load of 2 kg, a head speed of 2.0 mm/s, a distance of 8.0 mm, and a force of 5 g. Hardness, springiness, and cohesiveness were measured, and gumminess and chewiness were calculated (Bourne, 1978).
The thiobarbituric acid reactive substance (TBARS) values of each sample were determined using the method of Tarladgis et al. (1960) with minor modifications.
To quantify total aerobic bacterial populations, 10 g of the samples was added to 90 mL of 0.1% buffered peptone water, and the samples were then homogenized for 60 s. The homogenates were then serially diluted, and 0.1 mL portions of the diluted suspensions were surface-plated on tryptic soy agar (Difco™, Becton Dickinson, Sparks, MD, USA). The colonies were counted manually after incubation at 35°C for 48 h.
Each sample was tested three times, and all data were analyzed using the general linear model procedure of SAS® (version 9.2, SAS Institute Inc., Cary, NC, USA). The mean differences among relationships were separated by pairwise t-testing using a significance level of alpha=0.05.
Results and Discussion
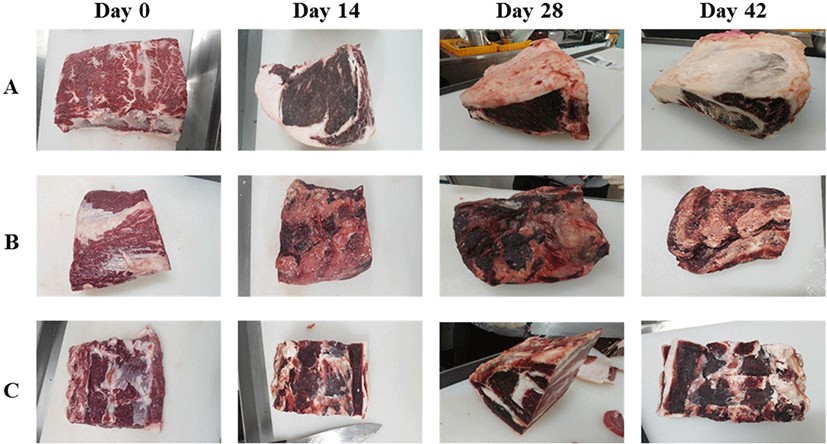
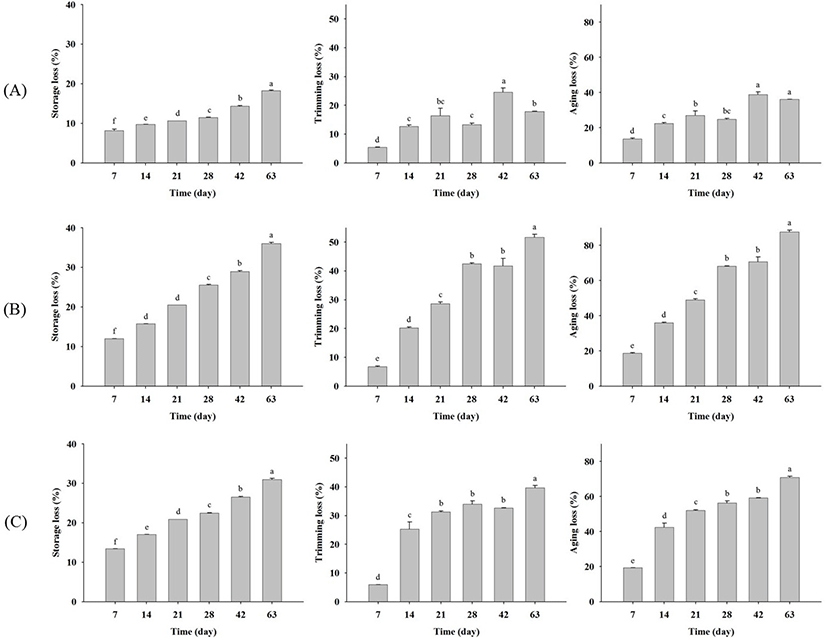
Fig. 1 shows changes in beef upon dry aging for each company, revealing that the surfaces of all samples became darker and drier with increasing aging time. The storage, trimming, and aging losses generally increased with aging time (Fig. 2). Dashdorj et al. (2016) determined the storage losses of dry aged beef as −10% (21 days), −15% (30 days), −23% (50 days), and −35% (120 days). Smith et al. (2014) also reported that trimming losses increased dramatically with aging time. Herein, the storage loss of all dry aged beef samples increased significantly (p<0.05) with aging time. For company A samples, storage losses on day 7, 14, 21, 28, 42, and 63 were obtained as 8.20±0.62, 9.75±0.01, 10.61±0.00, 11.47±0.11, 14.35±0.21, and 18.24±0.25, respectively (Fig. 2A). The storage losses of company B and C samples increased from 11.97±0.01 (7 days) to 36.01±0.49 (63 days) and from 13.40±0.01 (7 days) to 30.97±0.46 (63 days) (Fig. 2B). These results indicate that storage loss increased more rapidly in company B and C samples than in company A ones. Similarly, the trimming loss also increased significantly (p<0.05) with aging time for all samples, with the trimming loss rate being higher for company B and C samples. As a result, the aging loss of dry aged beef from company A was the smallest. These differences were due to those in the aging method. Company A aged samples comprised back fat including bone, whereas only loins without back fat were aged by companies B and C. Although the storage, trimming, and aging losses differed among the companies, the observed loss rates could be used to develop an aging factor to compare fresh and aged beef.


Table 1 summarizes the effects of aging time on beef moisture, fat, protein, and collagen contents, revealing the absence of clear trends. The same behavior was observed for pH values (Table 2). A previous study showed that moisture content (%) decreased with aging time (p<0.05), whereas protein and collagen contents (%) did not show any significant differences (p>0.05) (Cho et al., 2018). As moisture content is related to the lipid content (Hwang et al., 2010), which varies strongly by company, the former parameter is expected to be supplier-dependent. As such, these factors should not be used to develop a standard aging factor.
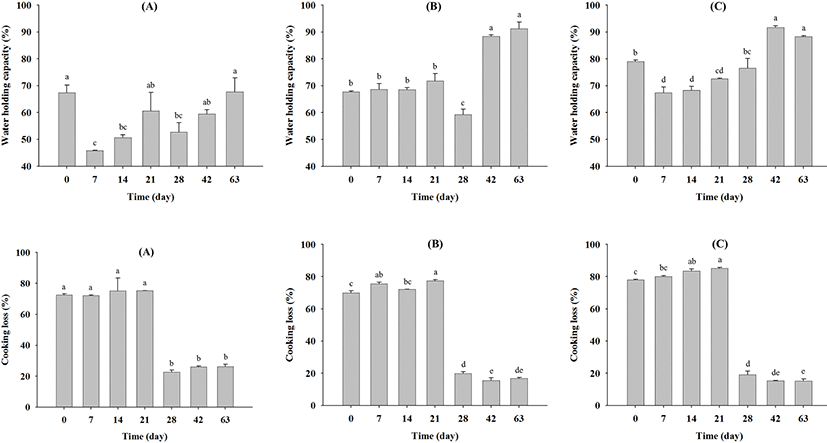
Changes in the water holding capacity (%) of beef during aging are shown in Fig. 3. For company A samples, the water holding capacity decreased significantly up to seven days of aging (p<0.05), subsequently increasing until 63 days (p<0.05) (Fig. 3A). Similarly, for company C samples, the water holding capacity decreased (p<0.05) from 79.06 (day 0) to 67.38 (day 7), then significantly increased (p<0.05) to 94.65 (day 42) and 88.27 (day 63) (Fig. 3C). Moreover, after 42 days, the water holding capacities of all samples exhibited significant differences. These results indicate that the beef dry aging method may increase the water holding capacity after 42 days. In contrast, cooking losses (%) during dry aging significantly decreased in all samples (Fig. 3), especially after 28 days, exhibiting significant differences (p<0.05) in all cases.

Changes in the shear force (kg) of beef during dry aging are presented in Table 3. The shear force decreased significantly (p<0.05) from 4.92 (day 0) to 1.68 (day 42) for company A samples; however, no clear trends were observed for company B and C samples. In addition, no increase or decrease trends were observed in the texture profiles of all tested samples (Table 4).
TBARS values for dry aged beef increased significantly with aging time (Table 5). Cho et al. (2018) reported that the extent of lipid oxidation increases with aging time; however, the TBARS values reported by these authors were <0.5 mg malonaldehyde/kg after 60 days of dry aging. Herein, TBARS values of 0.61, 1.19, and 1.64 mg malonaldehyde/kg were observed for company A, B, and C samples, respectively. Values of >1.00 mg malonaldehyde/kg are generally considered to indicate poor quality. In addition, total bacterial population was increased as aging time increased (Table 6), and the bacterial counts in B company was increased from 2.3 Log CFU/g (day 0) to 6.6 Log CFU/g. Thus, to ensure food safety, further study of lipid oxidation and microbiological analysis in dry aged beef samples is required.
| Company | Day 0 | Day 7 | Day 14 | Day 28 |
|---|---|---|---|---|
| A | 2.1±0.2 | 3.5±0.2 | 3.7±0.1 | 4.9±0.5 |
| B | 2.3±0.2 | 3.8±0.7 | 5.9±0.3 | 6.6±0.3 |
| C | 2.4±0.2 | 3.2±0.3 | 3.6±0.8 | 4.5±0.5 |
Conclusions
In conclusion, as the quality of dry aged beef varied among different companies, it was hard to identify aging factors for distinguishing between fresh and aged beef regardless of its manufacturer. However, as the storage loss, water holding capacity, and cooking loss exhibited significant changes with dry aging time in all tested samples, these factors should be considered as potential parameters for discriminating between dry aged and non-aged beef.


