Introduction
In the last decade, meat with vacuum packaging under chilled conditions has been supplied to the fresh market or consumers due to extended shelf-life. Recently, the effect of aging time on pork with vacuum packaging was researched by Tikk et al. (2008). However, vacuum packaging is unattractive to consumers due to perceptible purge loss and color denaturation of meat (Lagerstedt et al., 2011). In general, the pork has a lower storage ability compared to other meat because of the rapid postmortem glycolysis, the low hygienic status and risks of bacterial growth (Blixt and Borch, 2002).
Elemental sulfur has gained interest in the animal industry because sulfur metabolism can interfere with several enzyme activities and protein metabolism (Metyer et al., 2008). Sulfur-containing amino acids such as methioinine, cysteine, and taurine play important roles in animals (Shoveller et al., 2005). According to Brosnan and Brosnan (2006), cysteine is used to form disulfide bonds to link protein structure while methionine is converted into glutathione (an antioxidant enzyme) throughout the transsulfuration pathway. It has been reported that pigs fed high sulfur diet have enhanced antioxidant ability (Song et al., 2014). Kim et al. (2015a) demonstrated that the supplementation with 0.3% processed sulfur is acceptable to improve pork quality. However, there is scarce research about how the fresh meat quality of processed sulfur fed pigs changes through wet-aging.
The aim of this study was to evaluate the effect of dietary supplementation with processed sulfur on physicochemical properties (such as proximate compositions, pH, drip loss, cooking loss, color, free amino acids composition and shear force) and storage stability (lipid oxidation, volatile basic nitrogen, and total plate count) of vacuum packaged pork during aging.
Materials and Methods
A total of 40 three-way crossbred (Landrace × Yorkshire × Duroc) pigs with an average live weight of 8.51±1.12 kg (n=5 in each pen) were randomly assigned based on weight. Two dietary treatments were prepared for this experiment: Control diet (NP) and diet supplemented with processed sulfur (SP) to obtain 3 g/kg feed during the fattening phase (3 mon). Processed sulfur, which is registered at the Korea Feed Ingredient Association, was obtained from Jungmin Co., Ltd (Korea) and was contained 97.93% of elemental sulfur. The animal experiment was conducted at the abattoir of Pocheon Federation of Livestock Cooperatives. Animals were managed under the animal policy of Konkuk University (Korea). The dose of processed sulfur in the feed was determined according to a previous study (Kim et al., 2015a). No significant difference (p>0.05) in final live weight (about 120 kg) between the two groups was found. After slaughtering procedure, the Longissimus dorsi of pigs were obtained from the carcass. The obtained muscles were cut into pieces (about 500 g each piece) and sealed with vacuum packaging. The samples were stored at a refrigerated room at 1℃. Samples were collected at different time points of the experiment (0, 3, 7, 14, and 21 d during aging). Animal and experimental designs were expressed as Fig. 1.
Moisture, crude fat, crude protein, and ash of samples were measured according to the method of AOAC (1995). Data of proximate compositions were expressed as percentages (%).
Each sample with weight of approximately 300 g with vacuum packaging was placed at 1℃. They were weighed on 1, 3, 7, 14, and 21 d. Weight loss was calculated as weight difference expressed in percentage before and after placing in the refrigerated room.
Samples (about 100 g each) collected at 1, 3, 7, 14 and 21 d were vacuum packed and cooked to reach at core temperature 70℃. Cooked samples were cooled down with cold water for 30 min. Cooking loss was calculated as a percentage of weight loss before and after cooking.
Each sample (2 g) was collected and homogenized with 18 mL of distilled water. The pH values of homogenized samples were measured using a pH meter (pH 900, Precisa, Co., UK).
Color of sample after blooming for 1 h was expressed as values of CIE L* (lightness), CIE a* (redness), and CIE b* (yellowness). The lightness, redness, and yellowness values of samples were measured using a handy colorimeter (NR-300, Nippon Denshoku, Japan). The calibration of machine was conducted using a white plate (CIE L*=+94.48, a*=−0.67, b*=+3.31).
TBARS of sample was measured using the method of Witte et al. (1970). Briefly, 2 g of sample was homogenized with 10 mL of 10% trichloroacetic acid (TCA) solution and 0.04 mL of 0.3% BHT (Butylated hydroxytoluence) solution. The homogenized sample was reacted with 2-thiobarbituric acid solution (TBA) and heated in boiling water for 10 min. After chilling down, the absorbance of sample was measured at 532 nm using a spectrophotometer (Optizen 2120UV, Mecasys, Korea). Data were expressed as malondialdehyde (MDA) mg/kg. Standard curve of MDA formed from 1,1,3,3-tetraethxypropane (TEP) was used for calculation.
After cooking loss measurement, samples were cut into parallel strips of 100 mm2 at 30 mm in length. Shear force was recorded as peak force (kg) on a minimum of 10 strips from each sample using TX-XT2 (Stable Micro System Ltd., England) equipped with a triangular blade. The condition of this machine was designed as 50 kg load cell and 200 mm/min cross-head speed.
VBN measurement was conducted according to the Conway microdiffusion method (Conway, 1950). Briefly, 5 g of sample was homogenized in 45 mL distilled water at 12,000 rpm for 1 min and filtered with Whatman No. 1 filter paper. Filtrated sample (1 mL) was transferred to the outer place of Conway chamber. Then 1 mL of 0.01 N boric acid (H3BO3) solution and 50 μL Conway reagent (0.066% methyl red and 0.066% bromocresol green in ethanol) were added to the inner place of the Conway chamber. The Conway unit was closed immediately after the addition of 1 mL of 50% (w/v) potassium carbonate to the outer place. After incubating at 37℃ for 2 h, titration was progressed with 0.02 N sulfuric acid to the inner place of the chamber. Data were expressed as mg%.
The extracted sample was prepared according to the slightly modified Analytical Methods of Korean Food Standards Codex (2015a). The meat was sonicated in 75% Ethanol for 1 h and then the sonicated sample was extracted for 24 h at the room temperature. The extraction was filtered through 0.2 um filter (Millipore) to analyze for free amino acids by using an automatic amino acid analyzer (S2100, S4300, S5200, SYKAM, Germany).
Two grams of sample and 18 mL of 0.85% NaCl in sterile distilled water were transferred to a sterile stomacher bag and homogenized for 60 s with a bag mixer (Interscience Co., France). A 10−1 dilution was used for subsequent serial dilutions. Aliquot (0.1 mL) of sample with the appropriate dilution was spread onto Petrifirm Aerobic Count Plates (3M, Korea) in triplicates. Plates were incubated at 35℃ for 48 h. Colony forming unit (CFU) was expressed as Log CFU/ g.
This experiment was designed as a factorial model 2 supplementation (NP and SP) × 5 storage periods (0, 3, 7, 14 and 21 d) in triplicates using two-way analysis of variance (ANOVA). Differences among storage periods were evaluated by Duncan’s multiple range test using the General Linear Model (GLM) procedure of SPSS version 18.0 (SPSS, 2003).
Results and Discussion
Changes in proximate compositions of vacuum packaged loins from pigs fed with processed sulfur during aging are shown in Table 1. Moisture content of SP showed a higher tendency than that of NP (p<0.1). Moisture content of samples on days 3 was the lowest and showed an decline tendency during storage compared to sample on day 0 (p<0.001), whereas protein content slightly increased during storage (p<0.05), respectively. Ash contents in both NP and SP groups were increased at 3 d compared to other days. In addition, the ash content of the SP group was higher than that of the NP group (p<0.01). Increasing moisture and ash contents in pork from pigs fed processed sulfur supplementation, while processed sulfur supplementation decreased in lipid content in muscle (Kim et al., 2015a). Crude fat content of the SP showed a lower tendency than that of NP (p<0.1), whereas crude fat was not affected by aging time (p>0.05).
1)NP, normal diet fed pigs; SP, sample from 0.3% processed sulfur fed pigs. 2)Different superscript letters in the same row indicate significant differences during aging time, p<0.05.
Changes in pH, drip loss, cooking loss, and shear force of NP and SP groups during the aging storage are shown in Table 2. The pH values of both NP and SP groups increased (p<0.05) during the storage. High pH meat can improve the water-holding capacity and decrease cooking loss during ageing (Silva et al., 1999). Increased pH of meat during storage is associated with the formation of ammonia due to degradation of protein and amino acid (Nychas et al., 1998). However, no significant difference between the treatments was proved (p>0.05).
1)NP, normal diet fed pigs; SP, sample from 0.3% processed sulfur fed pigs. 2)Different superscript letters in the same row indicate significant differences during aging time, p<0.05.
Weight loss of SP showed an increasing tendency at 3 d after aging and a decreasing tendency from 3 d to 21 d (p<0.1). Weight loss of SP was significantly lower than that of the NP (p<0.05). Lee et al. (2009) proved that the drip loss of sulfur compounds fed pigs decreased. Cooking loss of NP and SP groups showed no significant difference. The cooking loss of SP on day 3 was significantly increased compared to other days (p<0.05). Similar result was shown by Straadt et al. (2007), who reported that cooking loss increased during the initial four days of aging because of the degradation of fibers such as collagen. The cooking loss of SP reversely decreased from 3 d to 14 d and then the cooking loss increased from 14 d to 21 d (p<0.05). This result was might be related to increasing cooking time of aged meat due to decreasing heat conduction of aged meat. George-Evins et al. (2004) proved the relation between increasing cooking loss and cooking time of aged beef. Moreover, there was a significant interaction between diet and aging (p<0.05). This result was caused that NP had a decline tendency of cooking loss, whereas cooking loss of SP increased on day 3 and decreased on day 21. High collagen solubility of pork from processed sulfur fed pigs was reported by Kim et al. (2015b). Kristensen and Purslow (2000) have also reported that degradation of cytoskeleton proteins such as desmin, vinculin, and talin during aging can enhance the water-holding capacity of meat due to inflow of extracellular water.
Processed sulfur supplementation did not influence shear force value (p>0.05), while aging time affected the shear force of pork (p<0.001). Aging time and treatment interaction of shear force was observed (p<0.05). Shear force of the NP group was not significantly decreased during aging time, while the shear force of the SP group on day 21 was lower than that at 0 d (p<0.05). Reduction in shear force of pork during aging has been reported by Juarez et al. (2011). Significant difference in time and treatment interaction of shear force was found (p<0.01). Shear force of meat is associated with several factors such as intramuscular fat content and crosslink protein such as collagen (Wang et al., 2016). As mentioned above, the increase proteolysis index and collagen solubility of meat from the processed sulfur fed pig were reported by Kim et al. (2015b).
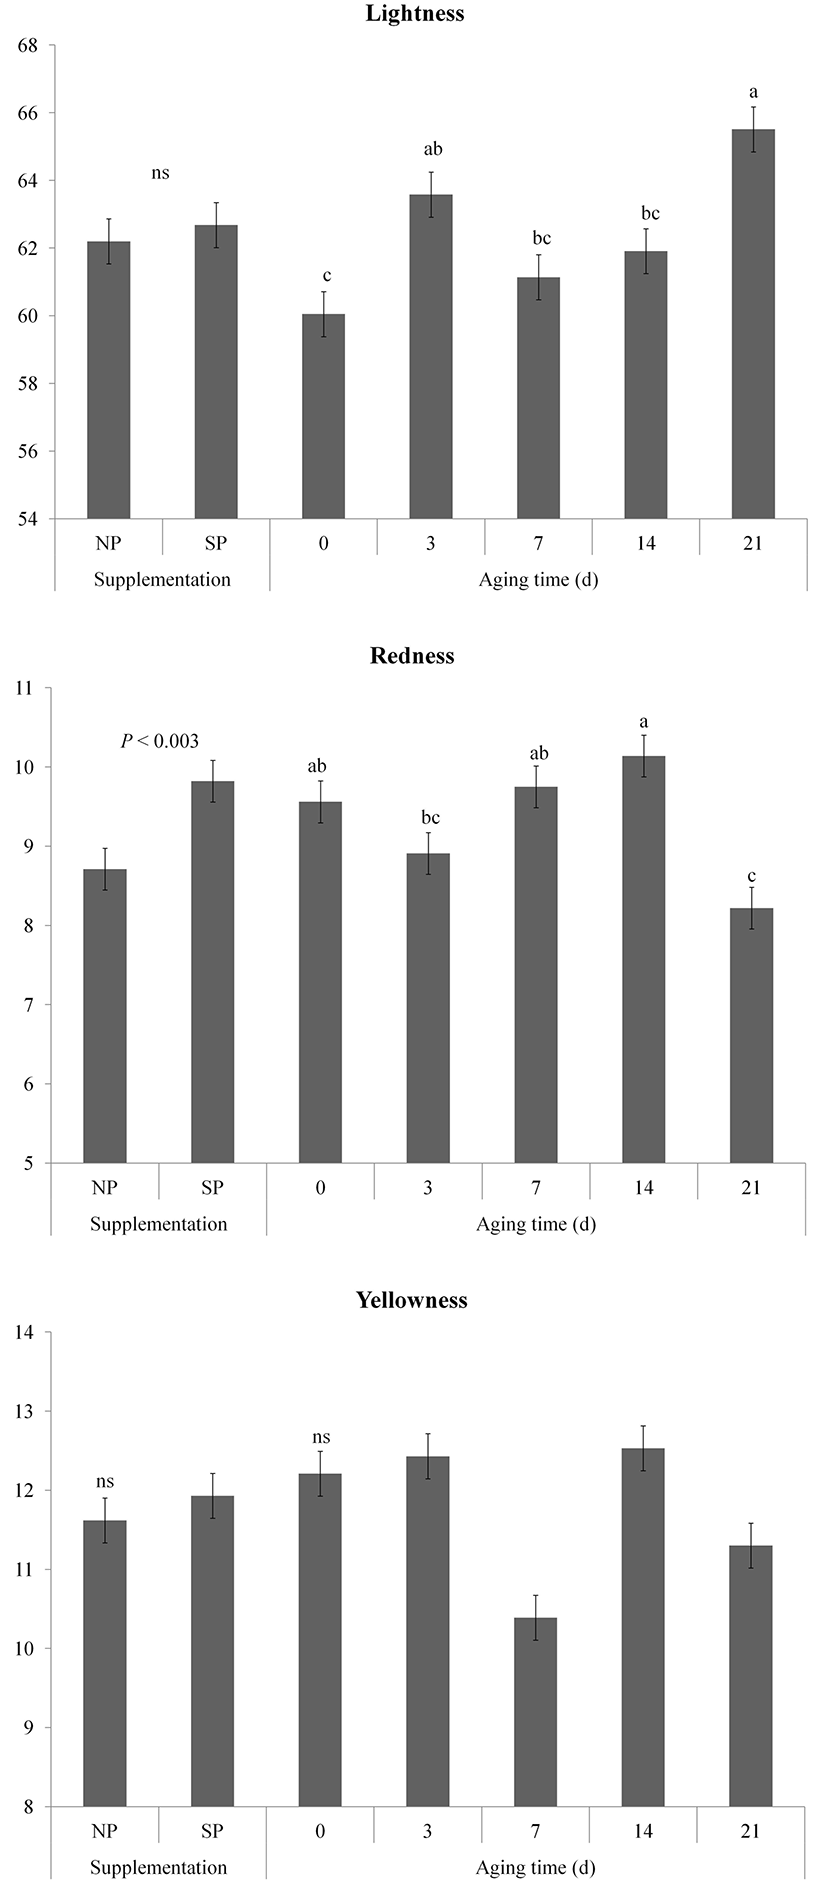
Changes in color (lightness, redness, and yellowness) of vacuum packaged meat from pigs fed processed sulfur during aging are shown in Fig. 2. The lightness (CIE L*) value of samples gradually increased during storage (p<0.01). The supplementation and aging time interaction effect on lightness was detected (p<0.05). The lightness value of the SP group had a tendency to be higher than that of the NP group on days 21 after aging (p<0.1). Oliete et al. (2005) have observed that the lightness value of meat is increased during aging. The lightness of aged meat is coincided with disk Z degradation during aging, resulting in expression of lighter meat (Swatland, 1982).

Redness (CIE a*) of SP was higher than that of NP because of processed sulfur supplementation effect (p<0.01). Redness of samples on days 21 significantly lower than that of samples aged 0, 7 and 14 d (p<0.05), whereas the interaction effect was also proved (p<0.01). Redness values of the NP group at 3 d and 7 d after aging were higher (p<0.05) compared to those at 0 d. However, the redness values of the NP group at 14 d and 21 d were lower (p<0.05) compared to those at 0 d. Similarly, the redness values of the SP group at 7 d and 14 d were higher (p<0.05) compared to those at 0 d. They were decreased (p<0.05) on day 21. Seydim et al. (2006) have reported that myoglobin oxidation can decrease the redness of meat when the pH of meat is high. Previous study has shown that pigment oxidation of processed sulfur fed pigs is retarded compared to that of pigs fed basal diet (Kim et al., 2015c). In this study, the redness values of the SP group at 14 d and 21 d were higher (p<0.05) compared to those of the NP group. Consumer acceptance of meat has a positive correlation with redness value of meat (Renerre, 2000). Therefore, the high redness of the processed supplementation might increase acceptability of consumer.
Yellowness (CIE b*) values of both NP and SP groups remained stable (p>0.05) during the aging. In addition, there was no significant (p>0.05) difference in yellowness between the NP and SP groups during aging.
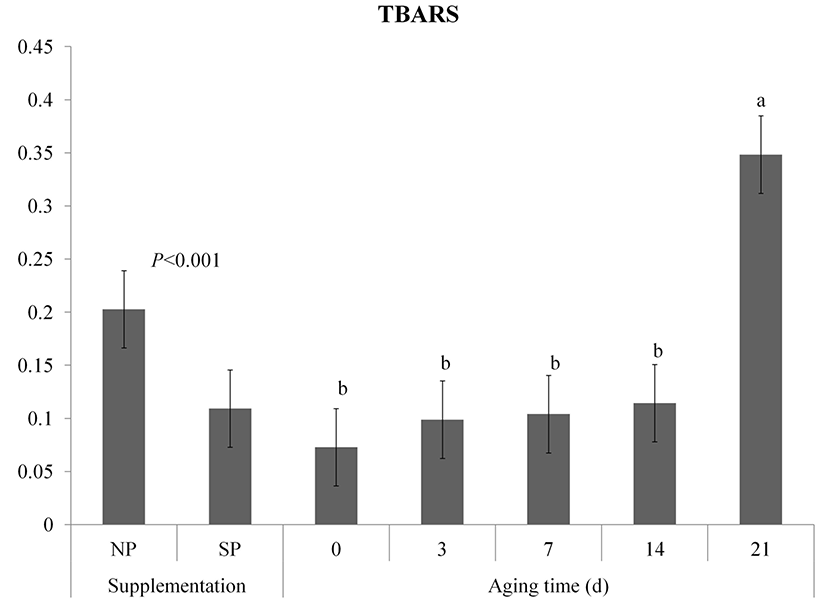
TBA values of both NP and SP groups of vacuum packaged meat during aging are shown in Fig. 3. Processed sulfur supplementation inhibited the increasing TBA value (p<0.001). The TBA values of both groups were gradually increased (p<0.05) during storage and the interaction effect on TBA was observed (p<0.05). The SP group had lower TBA values at 14 d and 21 d than the NP group (p<0.05). Inhibition of lipid oxidation in meat from processed sulfur fed pigs has been proved by Kim et al. (2015a). Song et al. (2013) have found that sulfur-containing antioxidants in meat such as methionine, taurine, and glutathione enzyme are increased if pigs are fed high sulfurcontaining diet. In the transsulfuration pathway, methionine is transformed into cysteine and then the cysteine is converted into glutathione (McBean, 2012).

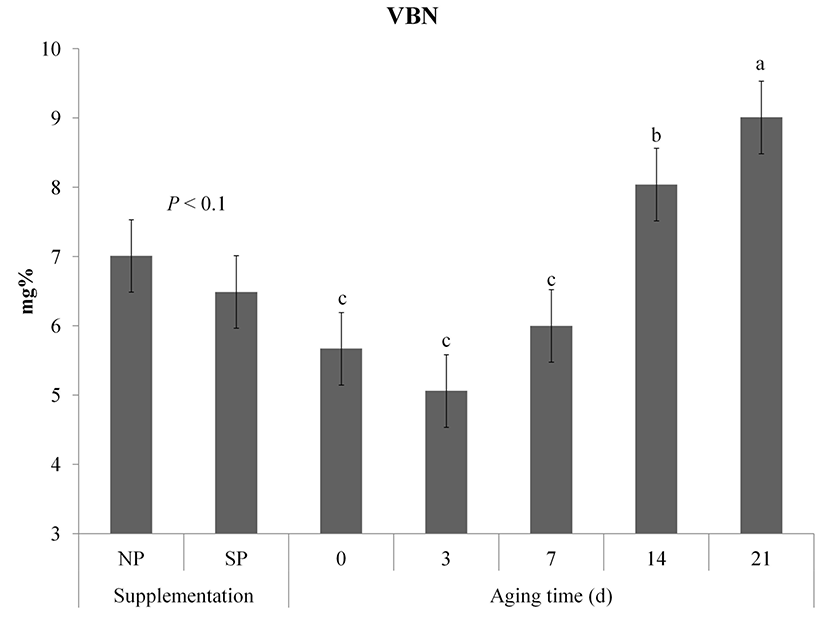
Changes in VBN of vacuum packaged meat are shown in Fig. 4. Although VBN was not significantly affected by processed sulfur supplementation, NP showed a slightly incline tendency compared to SP (p<0.1). VBN contents of samples were significantly increased during aging (p<0.05). VBN contents of the NP group at 0 d and 14 d were higher (p<0.05) than those of the SP group. However, there was no significant difference in VBN between NP and SP on day 21 after aging (p>0.05). VBN is considered as an important factor that determines the degree of microbial contamination and protein degradation in meat (Hur et al., 2011). According to Korea Food and Drug Administration (2002), the VBN of fresh raw and packaged meat is allowed below 20mg%. The VBN contents of both NP and SP groups did not exceed the standard value until 21 d.

The changes in free amino acid contents in the NP and SP are expressed in Table 3. Free amino acids are an important indicator to determine aromatic flavor of meat with Maillard reaction and Strecker degradation (Barbieri et al., 1992; Ventanas et al., 1992). According to Nishmura and Kato (1988), the enhancement of meat taste during storage was proved due to the increasing free amino acids and each free amino acid has a characteristic taste such as sweetness (Gly and Ala), bitterness (Phe, Tyr, Trp, Leu, Val) and umami (Glu). In this study, the composition of all free amino acid was not different between both groups during storage (p>0.05). Most free amino acids in both groups significantly increased during storage (p<0.05), whereas the glutamine content was not changed during storage (p>0.05). The formation of glutamine is generated from the enzymatic reaction with glutamic acid and ammonia (Dura et al., 2004). Keynan et al. (1954) demonstrated that the reaction related to glutamine and glutamic acid was inhibited under anaerobic condition. Therefore, the result could be affected by vacuum packaging of meat. Although the taurine accounts for about 20% of free amino acid in meat, the taurine is not part of the muscle protein component (Aristoy and Toldra, 1998; Beriain et al. 2000). Taurine of samples at 3 d was decreased compared to the samples at 0 d (p<0.05). The interaction with treatment and time on taurine content was found (p<0.05). Taurine contained in drip loss of meat (Lambert et al., 2001). Therefore, this result may be related to water-holding capacity of meat. Cysteine was not detected in both groups, whereas the Met of SP was not significantly different compared to the NP (p>0.05). Aspartic and glutamic acid of SP showed incline tendencies than those of NP (p<0.1) and these free amino acids contents of both groups increased in day 21 without significant difference. Umami taste is enhanced when the Asp and Gln are combined with Inosine 5’-monophosphate (Rotzoll et al., 2005). Proline of SP was also a higher tendency than that of NP (p<0.01). Rezaei et al. (2013) suggested that the proline acts as the component of collagen protein in pigs. This result could be associated with collagen synthesis of processed sulfur fed pigs (Kim et al., 2015b).
1)NP, normal diet fed pigs; SP, sample from 0.3% processed sulfur fed pigs. 2)TFAA, total free amino acid 3) Different superscript letters in the same row indicate significant differences during aging time, p<0.05.
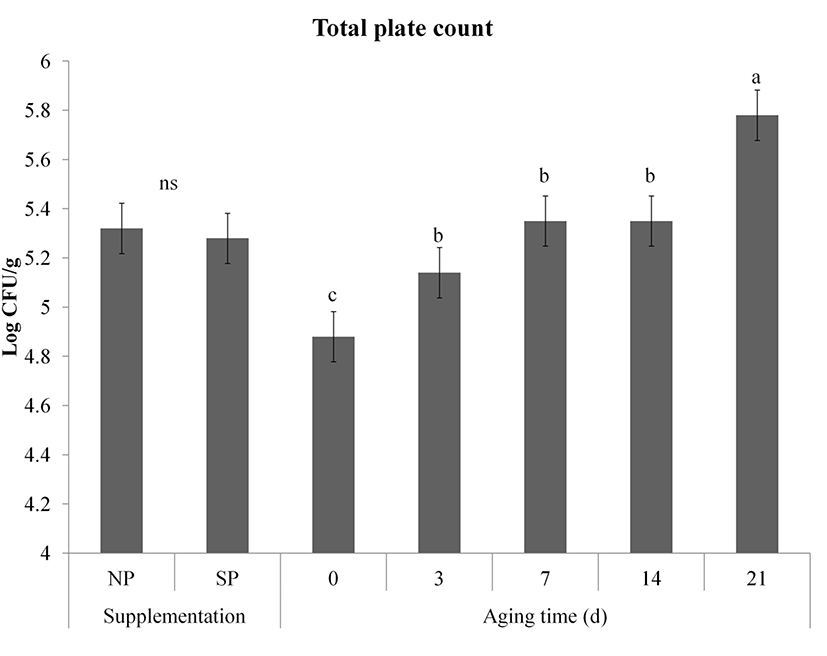
Change in total plate count of meat during storage is shown in Fig. 5. We speculated that the processed sulfur supplementation inhibited the growth total plate count since antibacterial effect of sulfur-containing compounds was proved by Kim et al. (2006). However, TPC was not affected by the processed sulfur supplementation effect (p>0.05). TPC of both NP and SP groups were significantly increased during storage (p<0.001). However, the TPC of both groups on day 21 did not exceed 6 Log CFU/g sample. Similar increased tendency of total plate count of vacuum packaged pork was observed by Blixt and Boch (2003) who reported that growth bacteria was more affected by slaughter hygience than species. Meat spoilage sign with off-odor production has been proved when TPC in raw meat is over 8.0 Log CFU/g (Egan and Grau, 1981). Therefore, the aspects of microbial safety, the post mortem conditions (hygiene and storage condition) might be more critical than pre-mortem condition (supplementation effect, species, etc.).

Conclusion
In conclusion, the aging yield and storage stability of pork from pigs fed processed sulfur were improved at 1-2℃ during ageing compared to those of pork from pigs fed basal diet. Low weight loss of pork from pigs fed processed sulfur was found during aging time in this study. The redness of pork from pigs fed processed sulfur was also higher than those of pigs fed basal diet. In addition, the lipid oxidation of pork from pigs fed processed sulfur was lower than that of pork from pigs fed basal diet. Therefore, pork from pigs fed processed sulfur resulted in improved meat quality and storage stability during aging.


