Introduction
The shelf-life of food is defined as an acceptable time period based on sensory aspects, nutrition, and food safety (Fu and Labuza, 1993). Prediction of shelf-life as soon as possible is important in the food industry. The accelerated shelf-life test (ASLT) is a good option for rapid prediction (Mizrahi, 2004). ASLT predicts the shelf-life of products based on the results of testing at regular intervals. The testing is done until the selected quality index reaches the quality limit after storing at the actual storage or distribution temperature and at least two other temperatures, and, based on the data, is predicted using the Arrhenius model (Park et al., 2014). When only temperature is used as a single variable, the Arrhenius model is useful to predict shelf-life (Kim, 2008).
Coffee is one of the most widely consumed beverages worldwide (Dorea and da Costa, 2005; Higdon and Frei, 2006; Sudano et al., 2005). Coffee consumption has been increasing annually (Chen and Lee, 2015). The market share of ready-to-drink type coffee beverages packed in glass bottles, metallic cans, and polyethylene containers, has been consistently growing globally (Shinozaki and Harada, 2014). The quality of coffee and beverages containing coffee begins to deteriorate immediately after production. The major environmental factors that accelerate deterioration are oxygen and storage temperature (Nicoli et al., 2009; Yoon et al., 2017). Accordingly, various methods need to be developed to prevent deterioration of the beverage quality.
Cocoa-derived foods, such as cacao powder and cacao nibs, are rich in phenolic compounds and have been widely studied globally (Wollgast and Anklam, 2000). The polyphenols identified from cacao nibs comprise three groups: catechins or flavan-3-ols, anthocyanins, and proanthocyanidins or leucoanthocyanins (Afoakwa et al., 2015). Consequently, the addition of cacao nibs is expected to extend the shelf-life of the milk beverage. Therefore, the objective of this study was to determine antioxidant effect and physico-chemical properties of coffee-containing milk beverage with cacao nibs extract and to predict its shelf-life using Arrhenius model.
Materials and Methods
Theobroma cacao (cacao nibs) was purchased from Gilim International Co., Ltd. (Kwangju, Korea). A commercial coffee-containing milk beverage was provided by Seoul F&B Co. (Seoul, Korea). It was composed of 30% raw milk, 28% coffee extract, 29% purified water, 6% sucrose, and 0.03% emulsifier.
Cacao nibs (400 g) were hydrothermally extracted with 1 L distilled water (DW) for 24 h. After the primary hydrothermal extraction, 1 L DW was added again to conduct the secondary hydrothermal extraction. The cacao nibs extract was centrifuged at 2,391×g for 10 min to remove all residue. After removal of the fat layer using n-hexane, the extract was lyophilized.
To prepare the coffee-containing milk beverage with 0.8% cacao nibs, lyophilized cacao nibs extract powder was dissolved in 10 mL sterilized Milli Q water at a concentration of 0.1575 g/mL. After pasteurization of the mixture at 100°C for 30 min, 10 mL of the mixture was injected into 200 mL of the milk beverage with a sterilized syringe, and the container was sealed using a silicon glue gun in an ultraviolet-illuminated clean bench. The prepared samples were used in the experiment after slight stirring. All samples were prepared for triplication.
Ten milliliters of beverage samples were used to measure the pH at 4°C using a pH meter (Mettler-Toledo, Shanghai, China). The measurement was conducted in triplicate. To assay TA of the beverage sample, 10 g was mixed with 10 mL DW and titrated with 0.1 N NaOH (Factor (F)=1.022). The volume of 0.1 N NaOH used for titration was substituted for lactic acid calculation in the following equation:
where F is the factor of 0.1 N NaOH.
Color values of each sample were determined using a CT-340 colorimeter (Minolta, Tokyo, Japan) calibrated using an original standard plate with the original value (X=97.83, Y=81.58, Z=91.51). The beverage was poured into a beaker (50 mL vol.). Then, the end of colorimeter detector was immersed into the beverage and determined repeatedly (15 times). The analyzed L*, a*, and b* values indicated lightness, redness, and yellowness, respectively, in artificial light.
The method reported by Morales and Jimnez-Prez (2001) was used to measure brownness. The beverage sample was diluted 30-fold, and the absorbance was determined at 420 nm using an X-ma 1200 spectrophotometer (Human Corp., Seoul, Korea).
Five milliliters of 7 mM ABTS solution were mixed with 88 μL of 140 mM potassium persulfate and sonicated for 10 min to generate cation radicals. The mixture was incubated in a dark room for 12 to 16 h to prepare the ABTS stable cation radical working solution. The working solution was diluted with DW to an optical density at 734 nm of 0.7±0.02 just before use in the experiment. Samples diluted to 0.5, 1, 1.5, 2, and 2.5 μg/mL were mixed with 1 mL ABTS solution. Each mixture was kept in the dark for 10 min to allow the cation radical scavenging reaction. The absorbance was assayed at 734 nm using an ELISA plate reader, and the ABTS radical scavenging activity (%) was calculated as:
where Asample is the absorbance measured after mixing with the sample and ABTS, and Ablank is the absorbance measured with 1 mL ABTS working solution and 1 mL DW instead of the sample. The slope was plotted using the five converted values and expressed as the effective concentration (IC50; concentration at which 50% of the cationic radical was scavenged) determined by the regression equation derived from the slope.
To prepare the reagent for the ferric reducing antioxidant power (FRAP) assay, acetate buffer (1) was using 0.25 M sodium acetate and 1 M sodium oxide, with the pH adjusted to 3.6 with 1 M HCl. 2,4,6-tripyridyltriazine (TPTZ) solution (2) was prepared by mixing 0.01 M TPTZ (Sigma-Aldrich Chemical Co., St. Louis, MO, USA) with the acetate buffer. Ferric chloride solution (3) was made by addition of 0.02 M ferric chloride in the acetate buffer. Finally, the working FRAP buffer used to assay radical scavenging activity was prepared by mixing of the above reagents in ratios of (1):(2):(3)=10:1:1, and stabilized at 37°C for 30 min. To assay scavenging activity, 25 μL of sample was poured in wells of a 96 well-plate and mixed with 175 μL working FRAP buffer. The mixture was incubated in a dark room for 30 min, and the absorbance was measured at 593 nm. A standard curve was made with gallic acid at concentrations of 0, 0.02, 0.05, 0.1, 0.2, 0.3, and 0.5 mg/L and converted to gallic acid equivalent to express reducibility.
To measure peroxide value (POV), extraction of fat in the samples was carried out according to the ISO 14156 method. One hundred samples were mixed with 80 mL of 95% ethanol and 20 mL ammonia in a separatory funnel, and were slightly stirred. For the primary fat extraction, 100 mL diethyl ether was added to the mixture and shaken vigorously. After 25 min incubation, the aqueous layer was removed. For the secondary fat extraction, 100 mL pentane was mixed with the residual organic solvent layer and stirred slightly. After 15 min, the aqueous layer was removed. To remove impurities, the solvent layer was processed with 100 mL of 10% (w/v) sodium sulfate and filtered through Whatman No. 2 filter paper (Whatman Inc., Maidstone, UK). Solvent was evaporated from the filtrate at 40°C to recover the fat. To titrate the peroxide, 0.5 to 1.5 g of the filtrate was mixed with 25 mL acetic acid and chloroform mixture in a ratio of 3:2, respectively, in saturated potassium iodide solution. Subsequently, 30 mL DW and 1 mL starch solution as the indicator were mixed in the mixture, and titrated with 0.01 N sodium thiosulfate. The POV was calculated as:
where a is the titrated 0.01 N sodium thiosulfate, b is the titrated 0.01 N sodium thiosulfate in the blank test, and f is the factor of 0.01 N sodium thiosulfate.
Caffeine contents of the samples were analyzed by HPLC using a model LC-20A (Shimadzu Co., Tokyo, Japan). The retention time was compared between the caffeine contents of the samples and standard caffeine (Sigma-Aldrich Co.). A Luna C18 column (10 μm, 250×4.6 mm; Phenomenex, Torrance, CA, USA) was used for the caffeine analysis. The mobile phase was prepared with methanol, water, and acetic acid at a ratio of 20:79:1. The flow rate of the mobile phase was 1.0 mL/min and the temperature of the column oven was kept at 40°C. The samples, which were filtered with a 0.45 μm syringe filter (Advantec Toyo Roshi Kaisha, Ltd., Tokyo, Japan) and diluted with 0.01 mg/min, were injected. The injected volume was 10 μL. The compounds isolated from the column were analyzed at 280 nm for 25 min.
ASLT was conducted to determine shelf-life of the beverage. Beverages with and without cacao nibs extract were stored at 10°C, 20°C, and 30°C for 4 wk. pH, TA, antioxidant activity, caffeine contents, and POV were analyzed, and sensory evaluation was done to predict shelf-life. The prediction involved linear regression calculated using the Arrhenius equation n from the ASLT data as described by Yoon et al. (2017).
Deterioration of a food quality was calculated as:
where A denotes food quality at time t, n is the order of the reaction, dA/dt denotes changes in the deterioration of food quality A with time, and k is a reaction constant. If the food quality deterioration followed zero-order reaction, it could be expressed as Eq. (2). Subsequently, Eq. (3) was obtained by integration of Eq. (2).
When the deterioration followed the first-order reaction, it could be expressed as Eq. (4). After integration of the first-order reaction Eq. (4), Eq. (5) was obtained.
Eq. (5) could be expressed as Eq. (6) by taking the natural logarithm.
The widely-used Arrhenius equation was applied to explain the temperature dependence of food quality deterioration, expressed as Eq. (7).
where T is absolute temperature, k is the reaction constant at temperature T, R is the gas constant (1.987 kcal/mol), and Ea is the activation energy.
By taking natural logarithm of Eq. (7), Eq. (8) was obtained.
where S is the slope and lnA, I represent the intercept.
Finally, in the case of zero-order reaction, the self-life was predicted as Eq. (9) and, if it followed the first-order reaction, it was expressed as Eq. (10).
where t is predicted storage period, A0 is the food quality at the initial time, and At is the food quality at a specific storage time.
Results and Discussion
Changes in color and brownness of coffee-containing milk beverage with and without cacao nibs extract at 10°C, 20°C, and 30°C during storage are listed in Table 1. Color measurements revealed no significant difference in lightness (L*) values, except for samples stored at 30°C (p>0.05). However, most of the L* values somewhat increased during storage. This result was not corresponded with Sopelana et al. (2013) who reported that the L* value of coffee brews slightly decreased and is distributed between approximately 19.77 to 25.60 during storage at 4°C. The L* value of the milk beverages was higher than the results from Sopelana et al. (2013). It is thought that the L* values of this study were higher than that of the researchers due to the addition of milk in the sample for this study. Redness (a*) values tended to decrease with longer storage time. The a* value of samples containing cacao nibs extract was 1.4-fold higher than that of the control group. The dark red color of the extract-containing samples may have been influenced by the redness of the beverage. Yellowness (b*) values were not significantly different in all samples (p>0.05).
Also, brownness of control and extract-added groups displayed a similar tendency of a* value decrease with storage time. Furthermore, the brownness decreased during storage. According to Delgado-Andrade and Morales (2005), brown-colored compounds of coffee as a result of caramelization and Maillard reactions during the roasting process is related to antioxidant activity. It is considered that a decrease of a* value and brownness involved with an antioxidant activity during storage is related to the report of Lopane (2018), who reported that the caffeine content of cold brew coffee decreased during storage.
Changes in pH and TA of control beverage and beverage containing cacao nibs extract are depicted in Fig. 1. The pH of all samples significantly decreased as storage temperature increased and storage period passed (Fig. 1A; p<0.05). In addition, as storage period passed, cacao nibs added sample showed approximately 0.15-0.22 lower pH value than that of control. The pH decrease was accentuated at higher storage temperatures. The findings were consistent with So et al. (2014), who reported that the pH of Dutch coffee decreased during storage, with a more pronounced decrease at higher storage temperature. Rosa et al. (1990) reported that the increase in various organic acids and caffeic or quinic acid due to the degradation of chlorogenic acid leads to the decrease of pH during storage. In addition, high storage temperature of coffee accelerates chlorogenic acid decomposition and increases sourness (Manzocco and Lagazio, 2009; So et al., 2014).
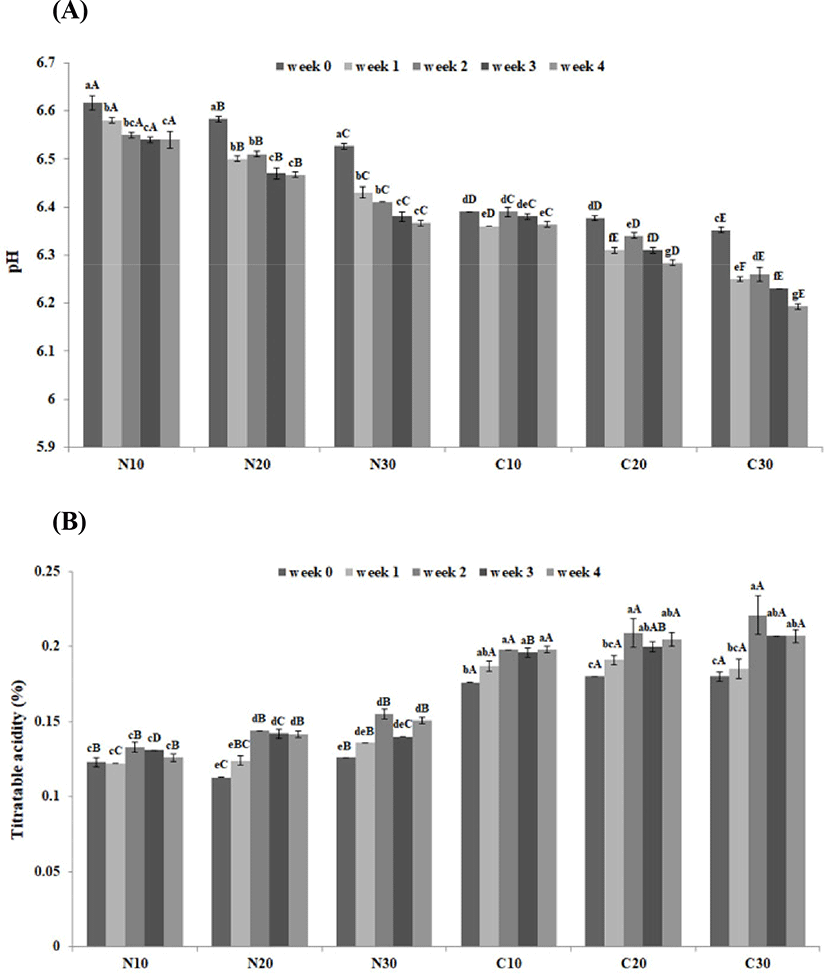
The TA of all samples significantly increased during storage (p<0.05); the increase was more pronounced at higher storage temperatures (Fig. 1B). In addition, samples containing cacao nibs extract displayed an approximately 1.5-fold higher TA than the control. Jinap and Dimick (1990) reported that the pH and TA values of Malaysian cacao were 4.89% and 0.198%, respectively. So et al. (2014) reported that the TA of Dutch coffee increased during the storage period and the higher storage temperature leads to the greater TA increase. Consequently, it is considered that an organic acid component contained in cacao nibs extract lowers the pH and increases TA of the coffee-containing milk beverage.
Fig. 2 shows the changes in the antioxidant effects of milk beverage supplemented with and without cacao nibs extract. The ABTS scavenging and FRAP assays we used are commonly used methods to determine antioxidant activity (Muller et al., 2011). Concerning the ABTS radical scavenging effect, the extract group displayed a lower IC50 value than the control group (Fig. 2A). A lower IC50 value indicates a higher antioxidant effect (Li et al., 2009). The IC50 values of control stored at 10°C, 20°C, and 30°C were slightly increased during storage, implying a time-dependent influence on the antioxidant effect in the control. There was no significant difference in the IC50 value of samples containing cacao nibs extract at the different storage temperatures in the 4 wk storage (p>0.05). Klimczak et al. (2007) reported that storage temperature did not affect phenolic compounds. Based on their results, data suggested that compounds in the extract have ABTS radical scavenging activity that is not relatively sensitive to temperature.
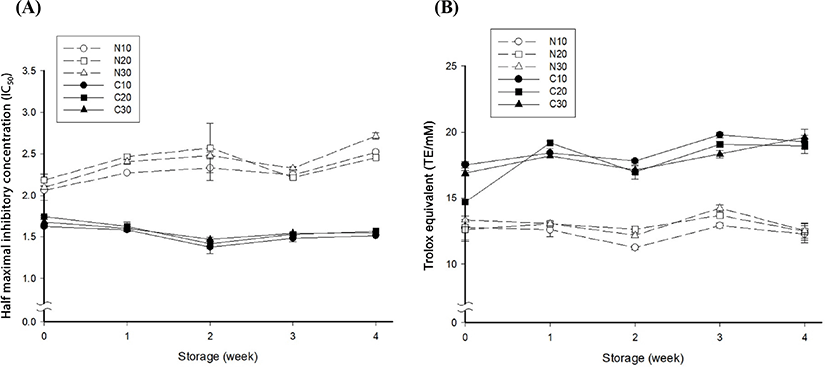
The changes in FRAP of the beverage samples during storage are depicted in Fig. 2B. Taken as a whole, samples containing cacao nibs extract displayed a higher FRAP than the control. The FRAP values of the samples containing cacao nibs extract, such as C10, C20, and C30, were 17.529, 17.126, and 16.890 TE/mM, respectively, initially and 19.260, 18.495, and 19.603 TE/mM, respectively, after the 4 wk storage. The average and standard deviation FRAP value of the extract-containing samples between the initial time and after 4 wk of storage was 17.182°0.323 and 19.269°0.328 TE/mM, respectively; the deviation was decreased by approximately 2%. For the control group, there was no significant difference among samples initially (p>0.05). FRAP values of N10, N20, and N30 were 11.232, 12.621, and 12.158 TE/mM, respectively, at 2 wk of storage and 12.519, 13.668, and 14.223 TE/mM, respectively, at 3 wk of storage. The average and standard deviation of the FRAP value of the control between the initial time and after 4 wk of storage was 12.893°0.377 and 12.411°0.142 TE/mM, respectively; the deviation was somewhat decreased. A similar trend was reported by Zafrilla et al. (2001). The authors described that the phenolic compound, ellagic acid, increased at the beginning of storage and then decreased slightly over the remaining storage period. It is known that the antioxidant effect of cacao nibs is caused by catechin, epicatechin, tannin and theobromine (Azam et al., 2003; Conti et al., 2012; Miller et al., 2006; Payne et al., 2010). Due to this, it is considered that the antioxidant effect of the cacao nibs added sample was higher than that of control. Consequently, the addition of cacao nibs extract could maintain antioxidant activity of the beverage over a certain level, and that the inhibition of lipid oxidation of the beverage could be expected.
Fig. 3 shows lipid oxidation of the samples stored at 10°C, 20°C, and 30°C for 4 wk. As the storage temperature increased, the POV of all samples tended to increase. In addition, samples containing cacao nibs extract generally displayed a lower POV than that of the control. Especially, the POV of samples containing the extract and extract-free samples stored at 30< (C30 and N30, respectively) initially showed no significant difference (1.91 and 1.98 meq/kg, respectively; p<0.05). However, the POV of C30 and N30 was 7.42 and 9.64 meq/kg, respectively, after the 4 wk storage. According to the IOC standard (IOC, 2006), in the case of animal fats or oils, 20-40 meq/kg is regarded as a rancid lipid, while 10 meq/kg or less is defined as fresh lipid. Based on these criteria, rancidity was absent in both groups. However, lipid rancidity was lower in the samples containing cacao nibs extract than in the extract-free group. This is thought to be due to the polyphenol compounds of cacao nibs extract. Hermann (1995) identified the polyphenol compounds of cacao nibs as epicatechin, catechin, gallocatechin, and epigallocatechin. According to Othman et al. (2007), these compounds remove hydroxyl and superoxide radicals, and have bioactivity comprising the inhibition of lipid peroxidation. Consequently, it is considered that the compounds from the cacao nibs extract used in this study affected the decrease in lipid oxidation.
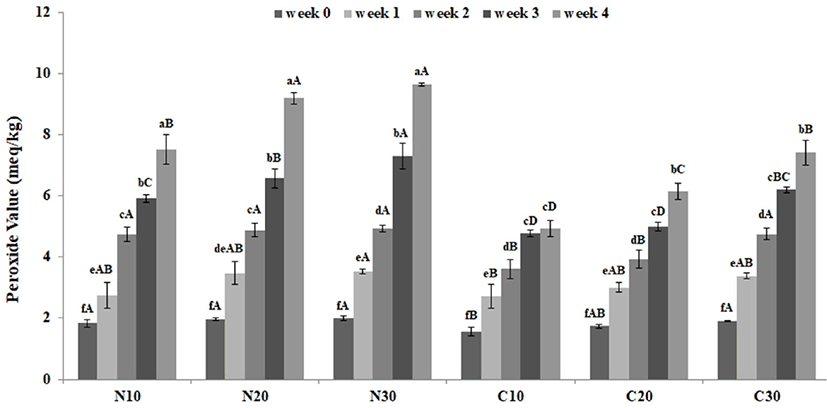
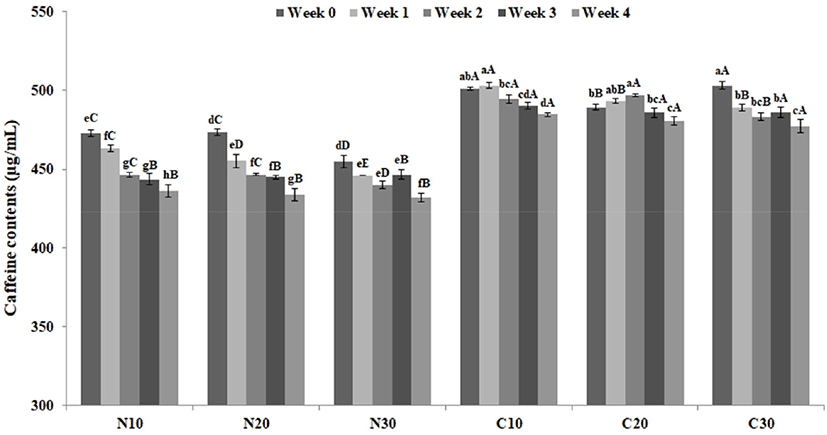
Fig. 4 depicts the changes in the caffeine content of beverage samples containing cacao nibs extract during storage. The caffeine content was higher than that of control samples. The caffeine content of samples containing cacao nibs extract may have been increased because of the extract. In addition, the caffeine contents of all samples tended to decrease during storage, and as the storage temperature increased, the decrease in caffeine content tended to increase slightly. This result is consistent with the findings of So et al. (2014), who described the decreased caffeine content of Dutch coffee during storage. Similarly, as mentioned above, Lopane (2018) reported that the caffeine content of cold brew coffee decreased during storage. However, the present results are inconsistent with the findings of Perez-Martinez et al. (2008), who reported that the caffeine content was not influenced by storage time and temperature. Caffeine exists as a monomer, dimer, tetramer or pentamer in aqueous solution (Balbuena et al., 2008). This leads to a shift of the absorbance in the detector. In the detector which was set to a single wavelength, it could not detect all of caffeine content (Lopane, 2018). It is considered that the use of a photodiode array detector which can detect various wavelength at the same time could analyze more accurately.
POV was chosen as the indicator to assess shelf-life of the beverage samples. Regressions and coefficient (r2) were calculated from the samples stored at 10°C, 20°C, and 30°C based on the POVs (Table 2). The coefficient values of the zero-order regression were higher than those of first-order regression, indicating that POVs increased following zero-order kinetics. The findings were different from the report of Labuza and Bergquist (1983) describing the first-order reaction kinetics of POV. The discrepancy could reflect the relatively short experimental period, even though it was ASLT. Yoon et al. (2017) also reported that the POV kinetics of coffee-containing milk beverage followed first-order reaction in an 8 wk ASLT.
The activation energies and regression values of control and cacao nibs extract-added samples calculated with the Arrhenius equation are provided in Table 3. The regressions of the extract-added and control group was lnK=−2,287.2468X+ 7.8665 (r2=0.9960) and lnK=−1,333.7587X+5.0599 (r2=0.9437), respectively. The respective activation energy was −4,526.8764 and −2,650.1785. The absolute value of the activation energy of samples containing cacao nibs extract was higher than that of control. Ahn et al. (2018) reported that a high absolute value for the activation energy corresponds to a longer storage period.
Assuming that the product is distributed at refrigeration temperature, the storage period at 4°C was calculated and is depicted in Fig. 5. The kinetic regression of the predicted shelf-life of samples containing cacao nibs extract and control was YPOV=1.2212X-2.097 (r2=0.9717) and YPOV=1.9440X-2.211 (r2=0.9883), respectively. The respective predicted shelf-life to reach quality limit (20 meq/kg POV) was approximately 18.09 and 11.43 wk. These findings indicate the effectiveness of the cacao nibs extract in prolonging the shelf-life of coffee-containing milk beverage. Lee and Kim (2003) reported that the shelf-life of the Korean traditional food, Gangjung, was extended by the addition of 1.5% ginseng. Similarly, according to Lee (1999), the addition of Ganoderma lucidum, Camellia sinensis, and Lycii fructus extracts effectively inhibited the increase of POV in walnut.
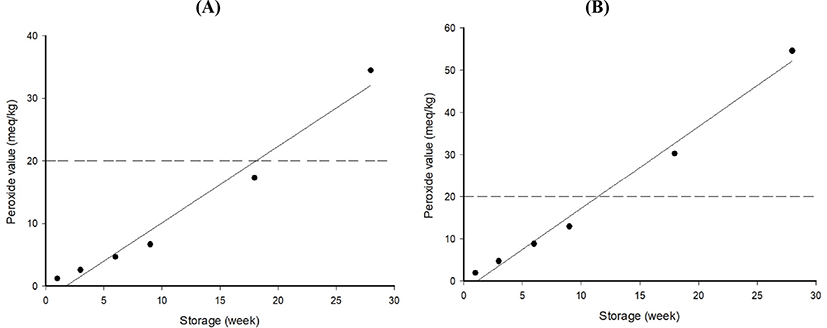
The Arrhenius model is simple, but fairly accurate equation, which can explain temperature dependent chemical kinetics (Mckeen, 2016). As mentioned above, the quality deterioration factors of coffee or coffee-containing beverages are known to temperature and oxygen. Thus, it is thought that this model is suitable to predict shelf-life of the coffee-containing milk beverage and to determine the effect of cacao nibs addition on shelf-life in the beverage.
Conclusion
This study aimed to extend the shelf-life of coffee-containing milk beverage. The addition of cacao nibs extract to the milk beverage caused physico-chemical changes The extract also improved the antioxidant effect compared to the extract-free control. Investigating the shelf-life using ASLT with POV as an indicator confirmed that the shelf-life of the milk beverage was extended by approximately 1.58 times by the addition of cacao nibs extract. The regression of the predicted shelf-life of the extract-added milk beverage was YPOV=1.2212X−2.097 (r2=0.9717) during storage at 4°C. The collective findings demonstrate that the addition of cacao nibs extract in coffee-containing milk beverage effectively prolonged the shelf-life of the beverage.


