Introduction
The rapid increase in the world population and the limited production of food sources has led to the livestock industry becoming an unsustainable practice (Kumar et al., 2021). As more consumers become aware of environmental and animal welfare issues associated with the food they use, global demand for healthy alternative options has increased (Hwang et al., 2021). This trend has triggered changes in the food culture to develop sustainable meat analogs that mimic the sensorial and nutritional attributes of animal meats. The two major groups of meat analogs are cultured and plant-based. Cultured meats are generally described as “artificial,” “laboratory-grown,” or “synthetic” substitutes for meat, while plant-based analogs are composed of plant-origin proteins (Sun et al., 2021).
Among the various properties of meat and meat products, color is often regarded as the most important attribute for the consumers’ intent to purchase. Fresh meats are represented by diverse colors depending on the species, distribution of muscle fibers, and exposure to oxygen. Meat color mainly depends on the types and amount of a sarcoplasmic protein called myoglobin (King and Whyte, 2006). Upon exposure to high levels of oxygen, myoglobin converts into oxymyoglobin, which is bright cherry red in color. However, after slaughter, myoglobin exists as deoxymyoglobin exhibiting a purple-red color (Tomasevic et al., 2021). During the cooking process, the color of meat changes to brown due to the denaturation of proteins, primarily myoglobin (Sakai et al., 2022). It is desired that meat analog products undergo a similar color change before and after cooking. Cultured and plant-based meat analogs generally have a pale and beige or yellow color, respectively, due to the absence of myoglobin. Efforts have been made to mimic the red color of meat by the addition of natural pigments such as beet juice and soy leghemoglobin during the culturing of the tissues (Fraeye et al., 2020). However, it is still necessary to search for the ingredients and conditions that can simulate the thermally induced color changes of meat in its analogs are still required.
In a recent study, Sakai et al. (2022) showed that the use of beet pigments—often used to simulate red color in meat analogs—is associated with the appearance of a yellow-like brown color after thermal treatment when used in plant-based analogs. Herein, we simulated the color of raw and cooked beef patty samples by combining beet powder (BP) and caramel color (CC). We hypothesized that CC could partially simultaneously offset the high brightness in raw samples and the excessive CIE b* in cooked samples that was caused by BP. We selected beef as reference material and utilized myoglobin-removed beef to produce patties incorporating BP and CC to investigate whether BP and CC can potentially replicate beef color even in the meat analogs based on animal tissues. This approach enabled us to assess the impact of BP and CC on the color characteristics of the patties in the absence of myoglobin. The novelty of this work is a multivariate statistical approach using response surface methodology (RSM) to optimize the levels of BP and CC to simulate the color of beef before and after cooking by considering the interactions between the two pigments.
Materials and Methods
Fresh beef (semitendinosus) and food grade BP and CC were purchased from a local market (Daejeon, Korea). Total of five carcasses (five batches) were obtained in five different days for the preparation of the source of beef with removed myoglobin (BRM). The excessive fats and connective tissues were removed, and the muscle was pulverized with a food mixer (C4 vv, Sirman SpA, Padova, Italy). To remove myoglobin (Lee et al., 2021), the ground beef was then mixed with an ice-cold buffer containing 0.1 M KCl, 2 mM MgCl2, 1 mM ethylene glycol tetraacetic acid, and 10 mM potassium phosphate (pH 7.0) in a 1:3 (w/w) ratio. The mixture was homogenized at 13,000 rpm for 30 s and centrifuged at 5,000×g for 10 min to separate the pellet. This procedure was repeated three times. Then, 0.1 M NaCl was added to the pellet in a ratio of 1:3 (w/w), and the homogenization and centrifugation were conducted three more times using the same conditions as described above. The pellet was washed with distilled water and used as BRM. The color attributes of beef before and after the removal of myoglobin are represented in Table 1.
The central composite design of RSM was used to set the optimum levels and the interactions between the independent factors influencing responses. First, we designated two independent factors (BP and CC) to a response (CIE L*, CIE a*, and CIE b* before and after cooking). Then, a five-level two-factor central composite design was employed, including five replicates of the central points. The coded levels of the independent variables are represented in Supplementary Table S1.
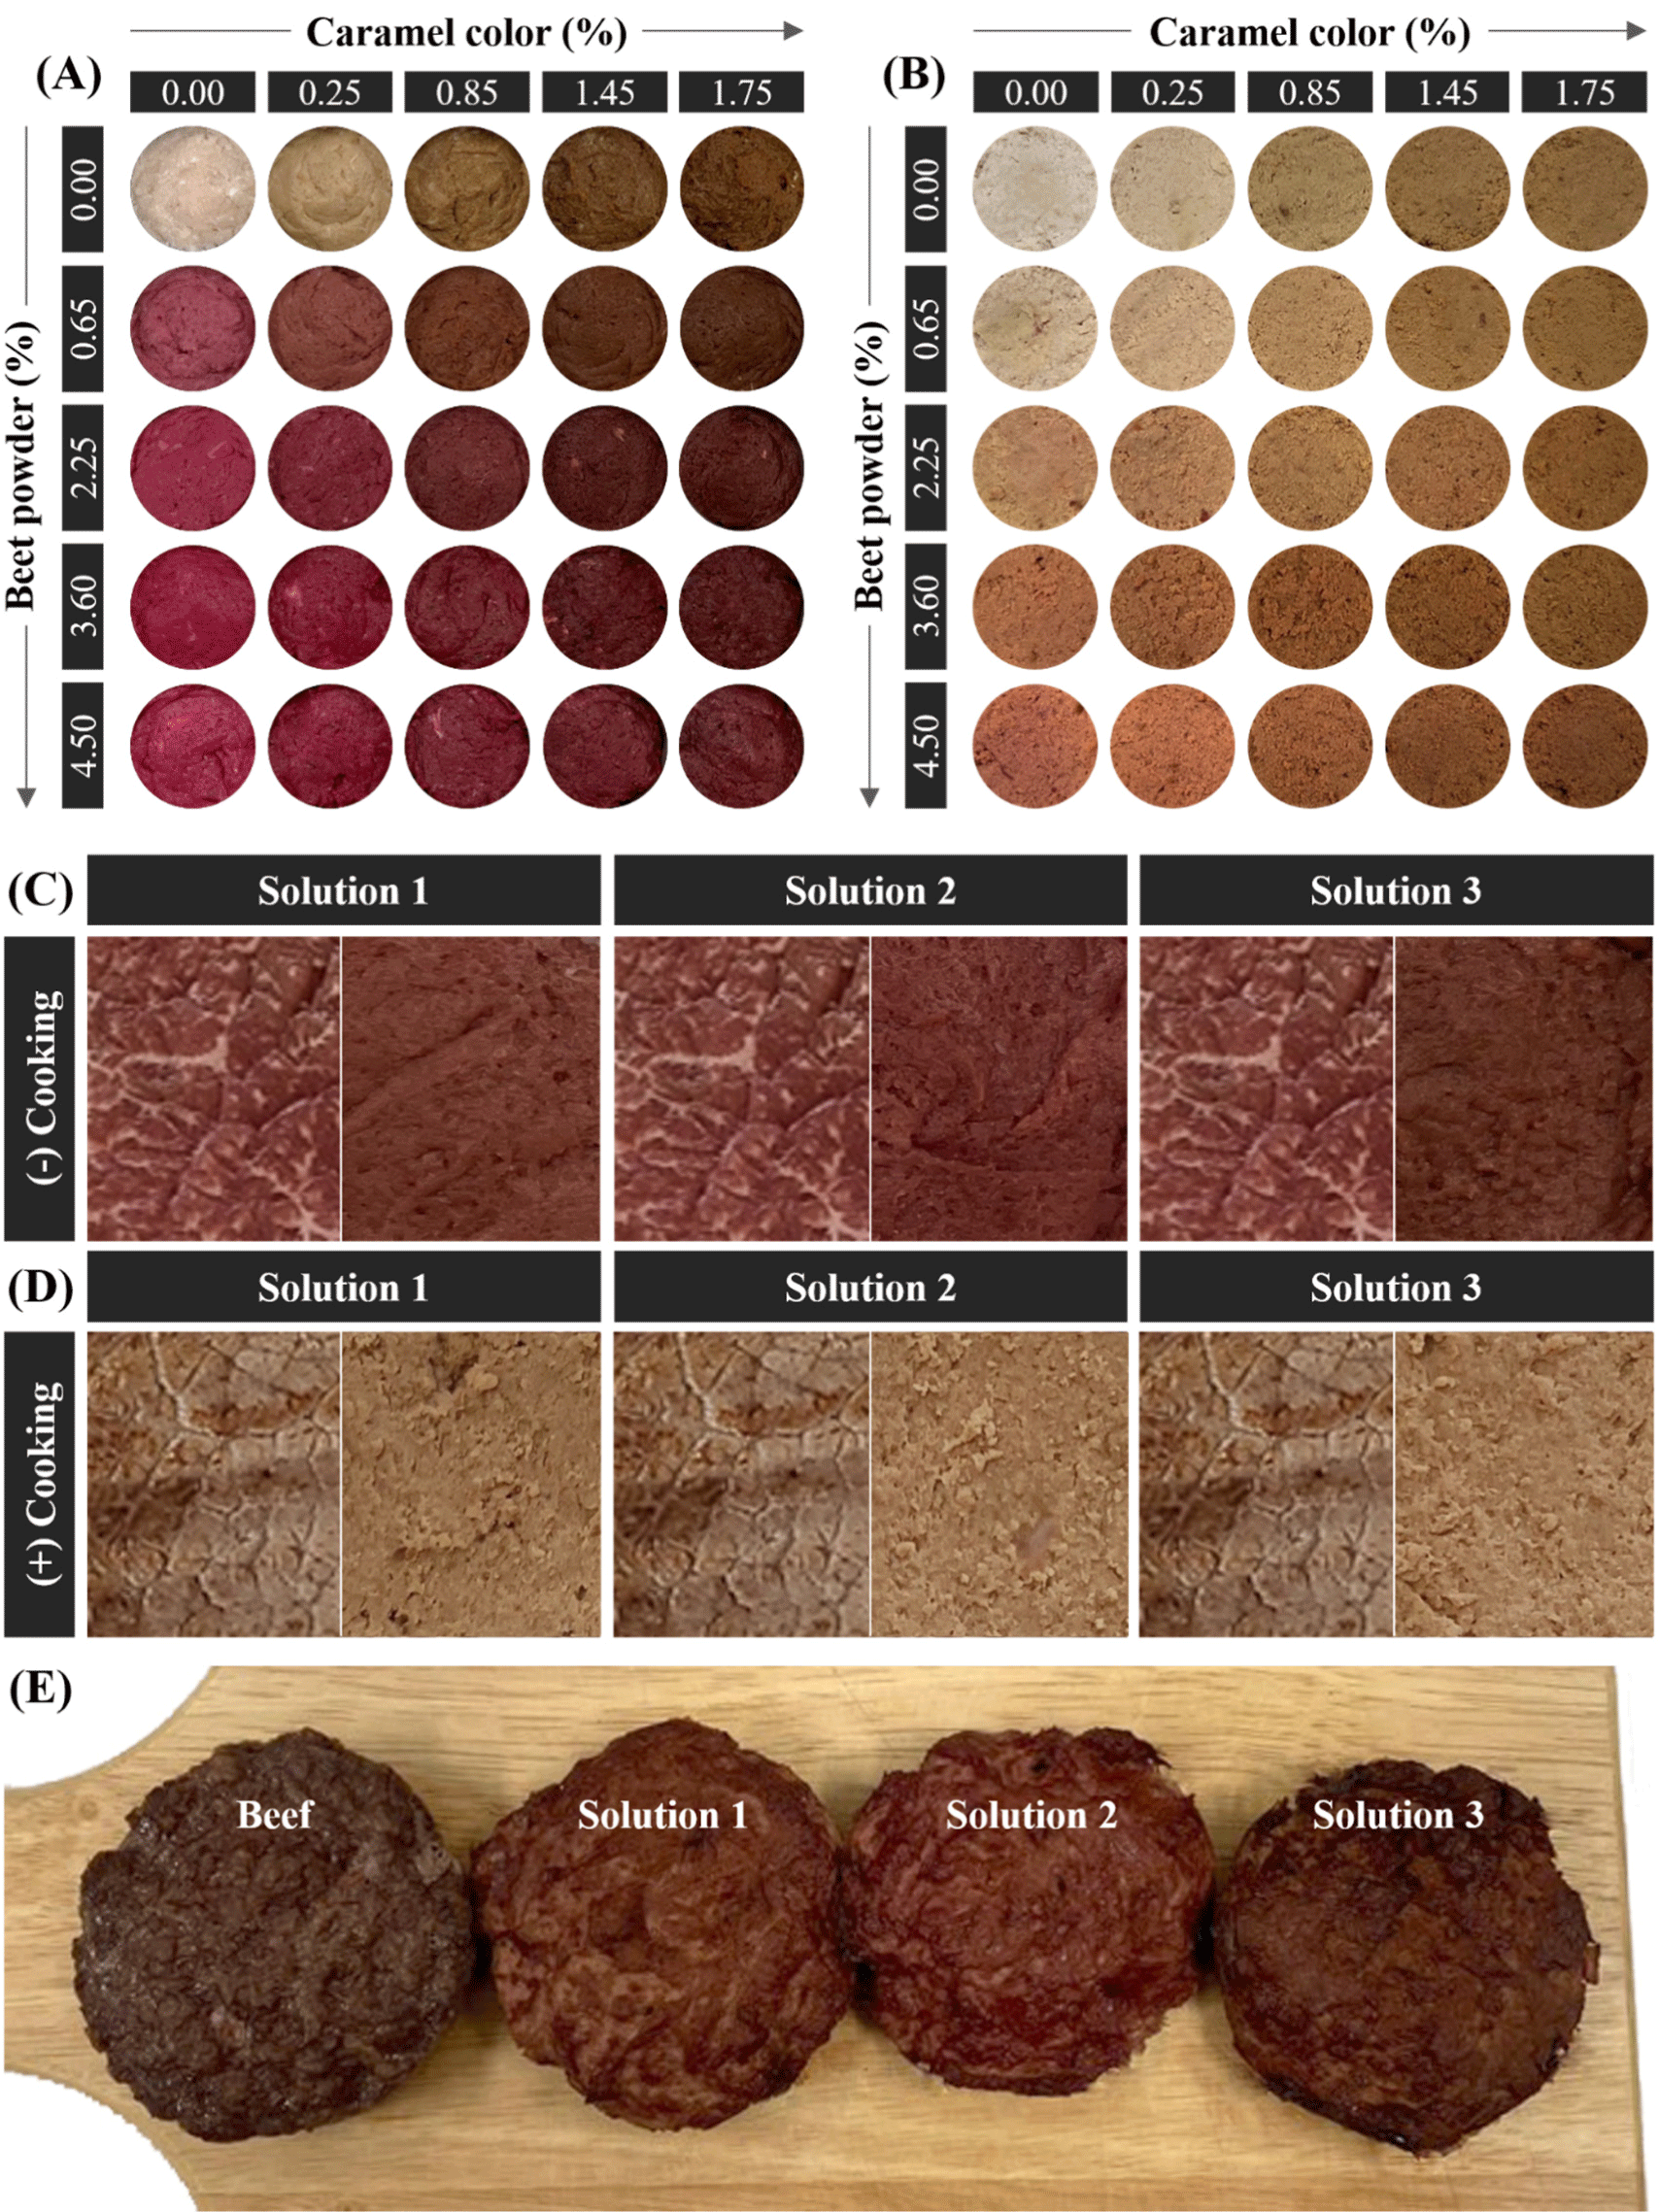
The BRM was used to produce beef patties with appropriate levels of BP and CC to replicate the color of beef (Supplementary Table S1). The BRM and the colors were thoroughly mixed using a food processor (FPM250, De’Longhi-Kenwood Appliances, Treviso, Italy) for 1 min. Then, the mixture was stuffed in a stainless can (5 cm in diameter) and vacuum-packed, followed by heating at 80°C to reach the core temperature of 75°C. Then, the patty was cooled at 25°C, and the drip was removed to analyze the color. Five patties were prepared in independent days for each level to provide replicates for the color measurements and statistical analysis. Figs. 1A and B show the appearance of the beef patties with five levels of BP and CC.

The color attributes (CIE L*, CIE a*, and CIE b*) were measured using a spectrophotometer (CM-5, Konica Minolta, Osaka, Japan) at two different parts of the cut inner surface (illumination area of 30 mm, illuminant D65, and standard observer of 10°). Blooming proceeded for 30 min before the color measurement. The average value of the two observation values was used as results for the analysis using Spectra Magic Software (SpectramagicTM NX, Konica Minolta).
Optimization of the concentration levels of the BP and CC was performed by RSM using Minitab 19 Statistical Software (Minitab, State College, PA, USA). Polynomial regression models were used to predict the responses, as presented in Table 2. In the model, the regression coefficients of the intercept, linear, quadratic, the involved interaction, and the probability level of p<0.05 were employed using one-way analysis of variance (ANOVA) to statistically test their effects. The response surface and contour plots were obtained by the Minitab software.
The models were validated using the coefficient of determination (r2), residual analysis, lack-of-fit test, and absolute average deviation (AAD). The first three analyses were conducted in Minitab software, and AAD was calculated using the following Eq. (1):
where p, yiexp, and yical indicate the experiment number, experimental response, and calculated response, respectively (Yolmeh and Jafari, 2017).
The levels (%) of BP and CC were optimized by the overall desirability features by setting nominal the best characteristics as the color of beef (CIE L*, CIE a*, and CIE b* before and after cooking). T-tests were carried out to determine the significance of the differences between the color of beef and the optimized color of the patties.
Results and Discussion
Table 3 shows the changes in the beef color before and after cooking based on the measured CIE L*, CIE a*, and CIE b*. Moreover, the appearance of the beef before and after cooking is represented in Figs. 1C and D. After cooking, the CIE L* increased from 34.00 (before cooking) to 45.05 (p<0.05) while the CIE a* (21.76 before cooking, and 6.69 after cooking) and CIE b* (18.33 before cooking, and 14.62 after cooking) decreased (p<0.05). These results indicate that the cooking process increased the CIE L* and decreased the CIE a* and CIE b*.
Myoglobin, a pigment responsible for the meat color, is an oxygen-binding protein (Tomasevic et al., 2021). When meat is exposed to oxygen after being cut, oxymyoglobin is formed under the presence of oxygen at normal atmospheric pressure, favoring the bright red color of fresh meat (King and Whyte, 2006). The surface of the inner cut of the beef patties was exposed to air for 30 min before the color measurement, resulting in the formation of oxymyoglobin as the predominant form of myoglobin in the analyzed parts of the raw beef. Conversely, the temperature of the beef patty’s core reached 75°C during the cooking process. At this temperature, most oxy- and deoxymyoglobin contents denatured and transitioned into ferrohemochrome and then ferrihemochrome with a characteristic brown color (Suman and Joseph, 2013), resulting in a decrease in the CIE a*. Notably, although we consider the thermally induced color changes as the main cause of “browning,” the denaturation of myoglobin and other meat proteins can also form a gray color, which can increase the CIE L* and decrease the CIE b*. Although myoglobin accounts for only 0.5% of the total weight of red meat (King and Whyte, 2006), this protein pigment apparently changes meat color before and after cooking. The corresponding changes in the color should also be simulated in the meat analog.
Herein, the concentration levels of BP and CC were optimized using central composite design. We set the highest levels of BP and CC to 4.5% and 1.7%, respectively, based on our pilot study. Color measurements were carried out by setting a goal for the levels of BP and CC to reach the levels corresponding to raw and cooked natural beef. Table 2 shows the fitted polynomial equations for the responses (CIE L*, CIE a*, and CIE b* before and after cooking). The fitted models were all quadratic by considering both the second-order and interaction equations of the dependent variables. All the models had p values less than 0.05, indicating that the models are significant. All terms in the models were also significant (p<0.05, data not shown).
In this study, r2, p value of the lack-of-fit test, residual analysis, and AAD were used to validate the fitted models (Table 2). High r2 and adjusted r2 values were observed in all models, indicating the high accuracy of the applied models (Yolmeh and Jafari, 2017). Moreover, the predicted r2 values were 0.96, 0.92, and 0.93 for CIE L*, CIE a*, and CIE b*, respectively, before cooking, and 0.98, 0.95, and 0.62 for CIE L*, CIE a*, and CIE b*, respectively, after cooking. The difference between the predicted and adjusted r2 was less than 0.2 in all cases, indicating the existence of a reasonable agreement. As Table 2 shows, all the p values in the lack-of-fit test were higher than 0.05, confirming that the polynomial equation can adequately describe the data.
In the residual analysis, normal probability plot and the residual errors versus run plot were obtained (Supplementary Figs. S1 and S2) to confirm whether the residuals follow the normal distribution or not. In the normal probability plot, if the residual points follow a linear trend, the normal distribution of data is confirmed. Moreover, in the residual versus run plot, the residuals are arranged based on the order of the experimental runs; therefore, all data points should be randomly scattered to follow the normal distribution (Deepanraj et al., 2021). Herein, all the normal probability and residual versus run plots for the equations indicated that our data is normally distributed (Supplementary Figs. S1 and S2).
Finally, we assessed AAD and statistical variability (Yolmeh and Jafari, 2017). All the calculated AAD values were less than 11%, implying that the models had high accuracy as Zirebwa et al. (2014) reported. Therefore, according to the tests for model validation, the fitted models in Table 2 could be successfully employed for the optimization process.
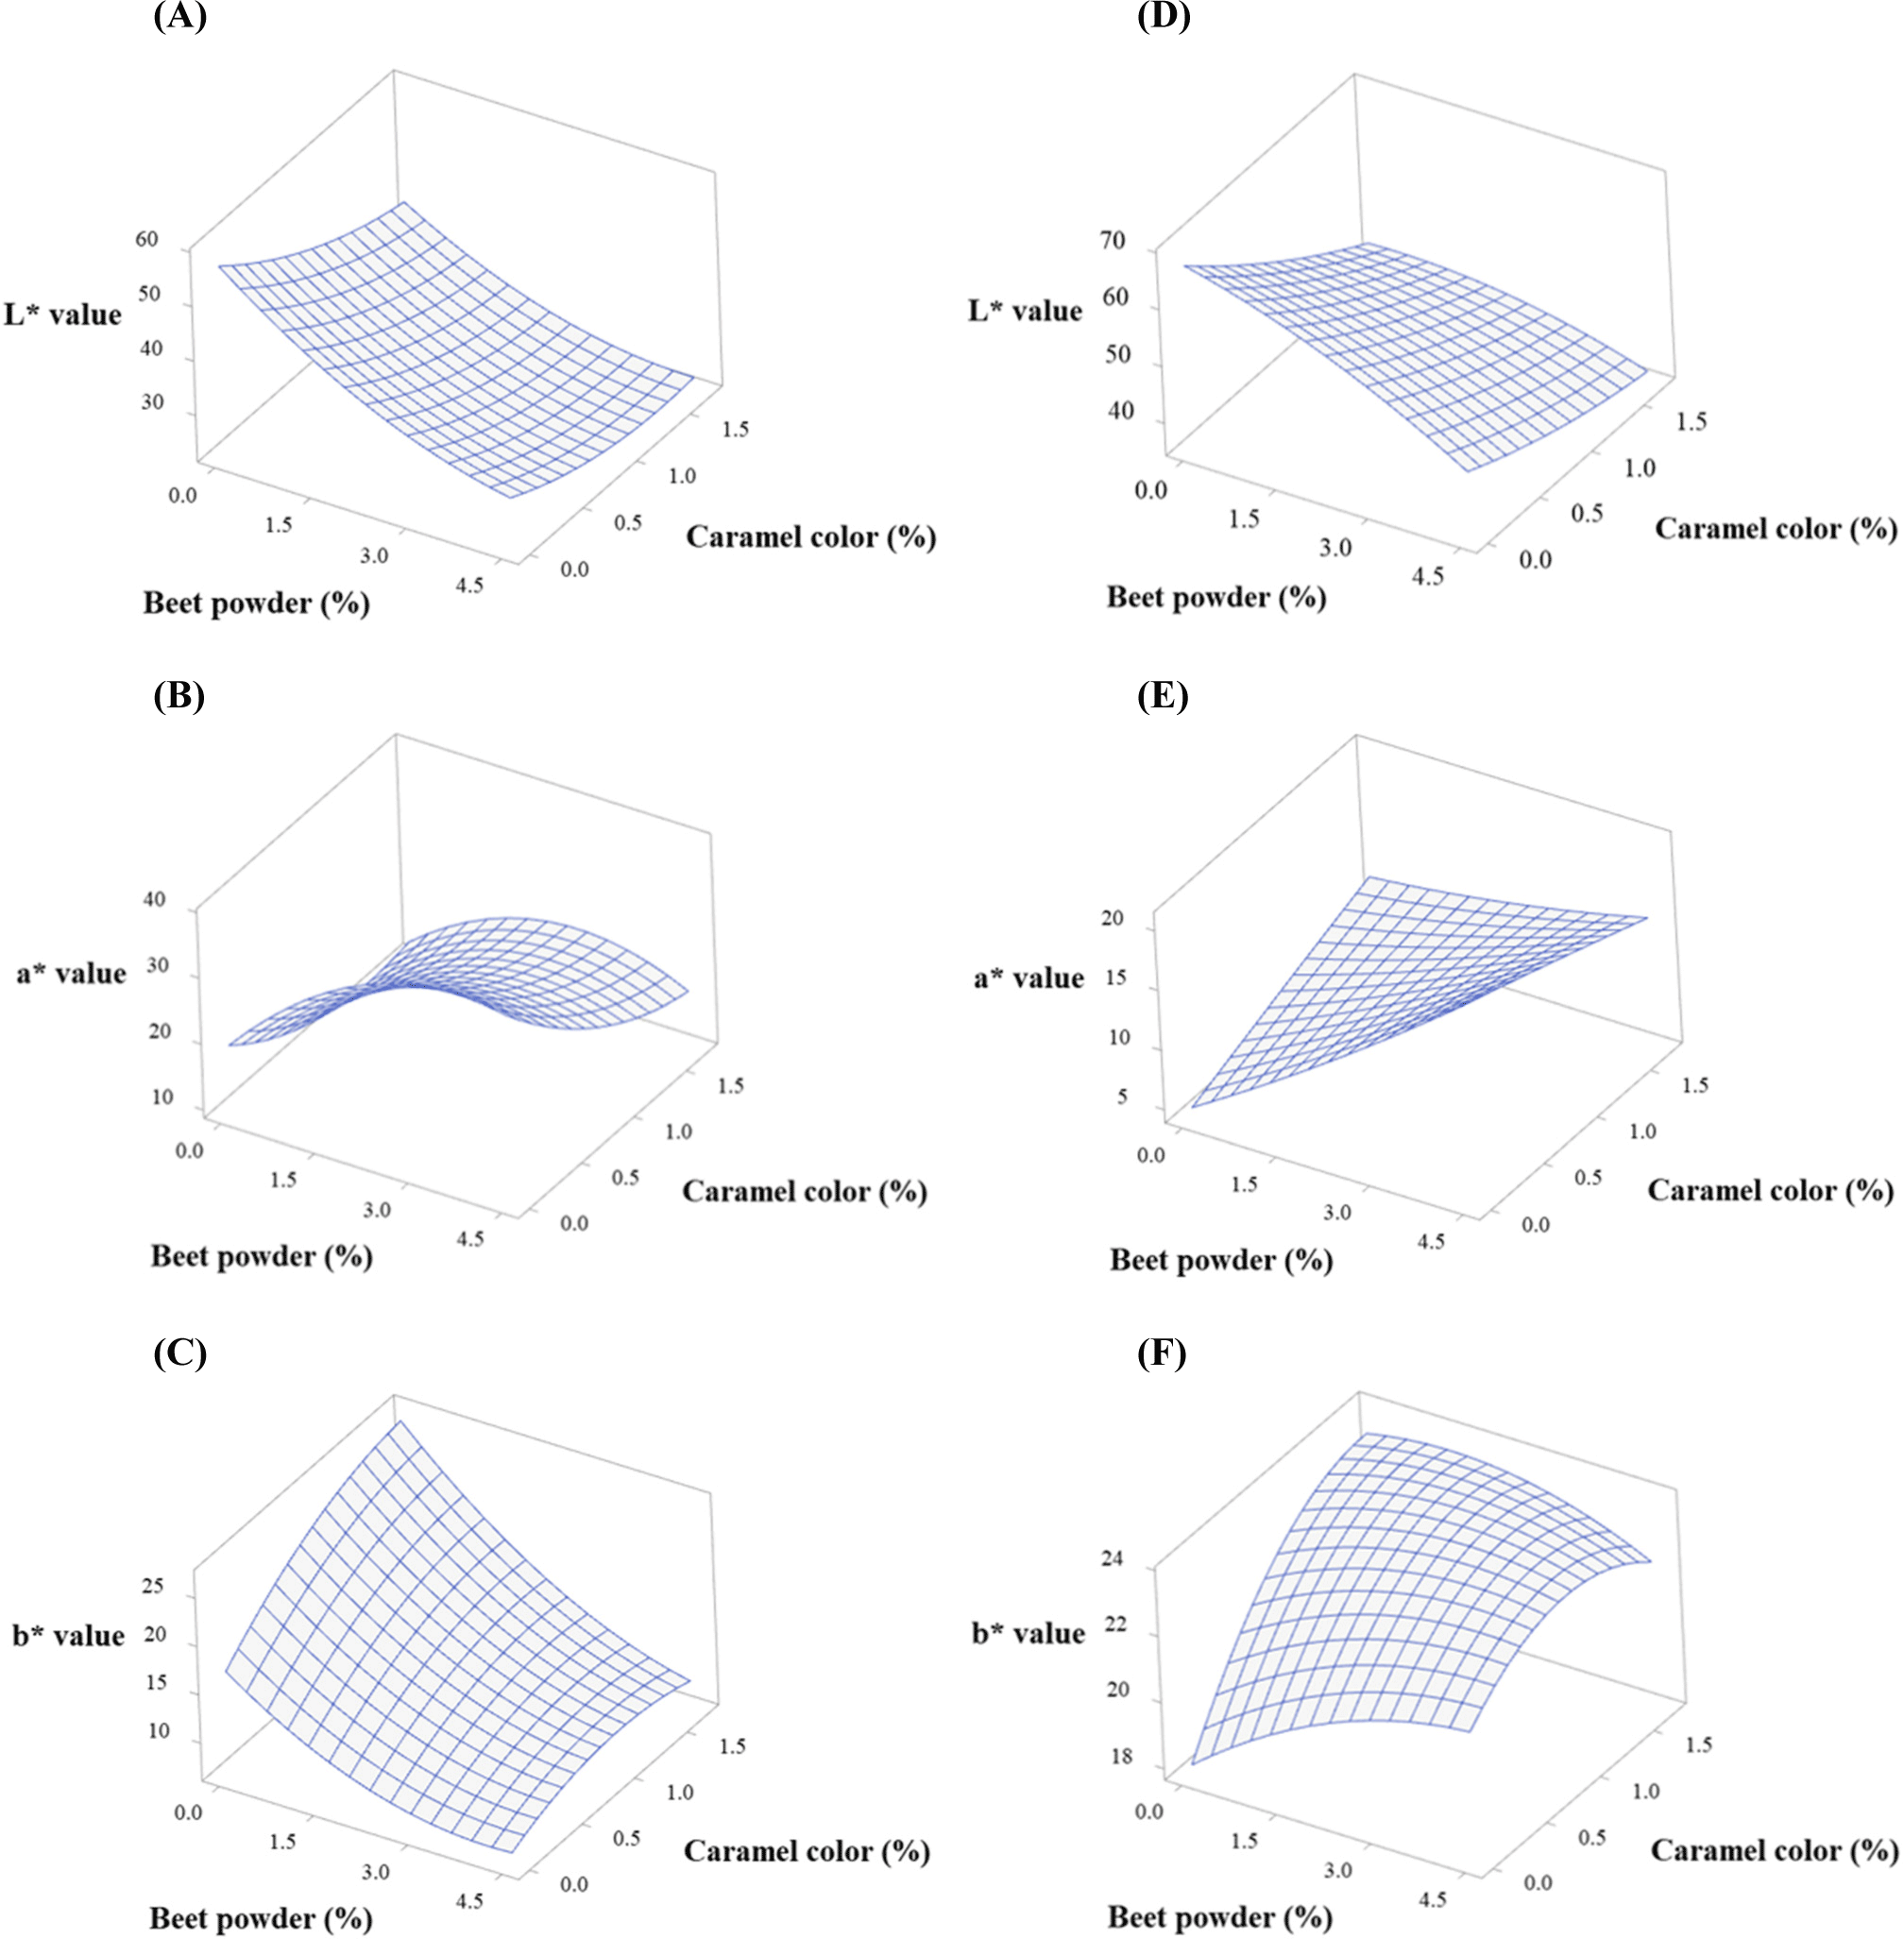
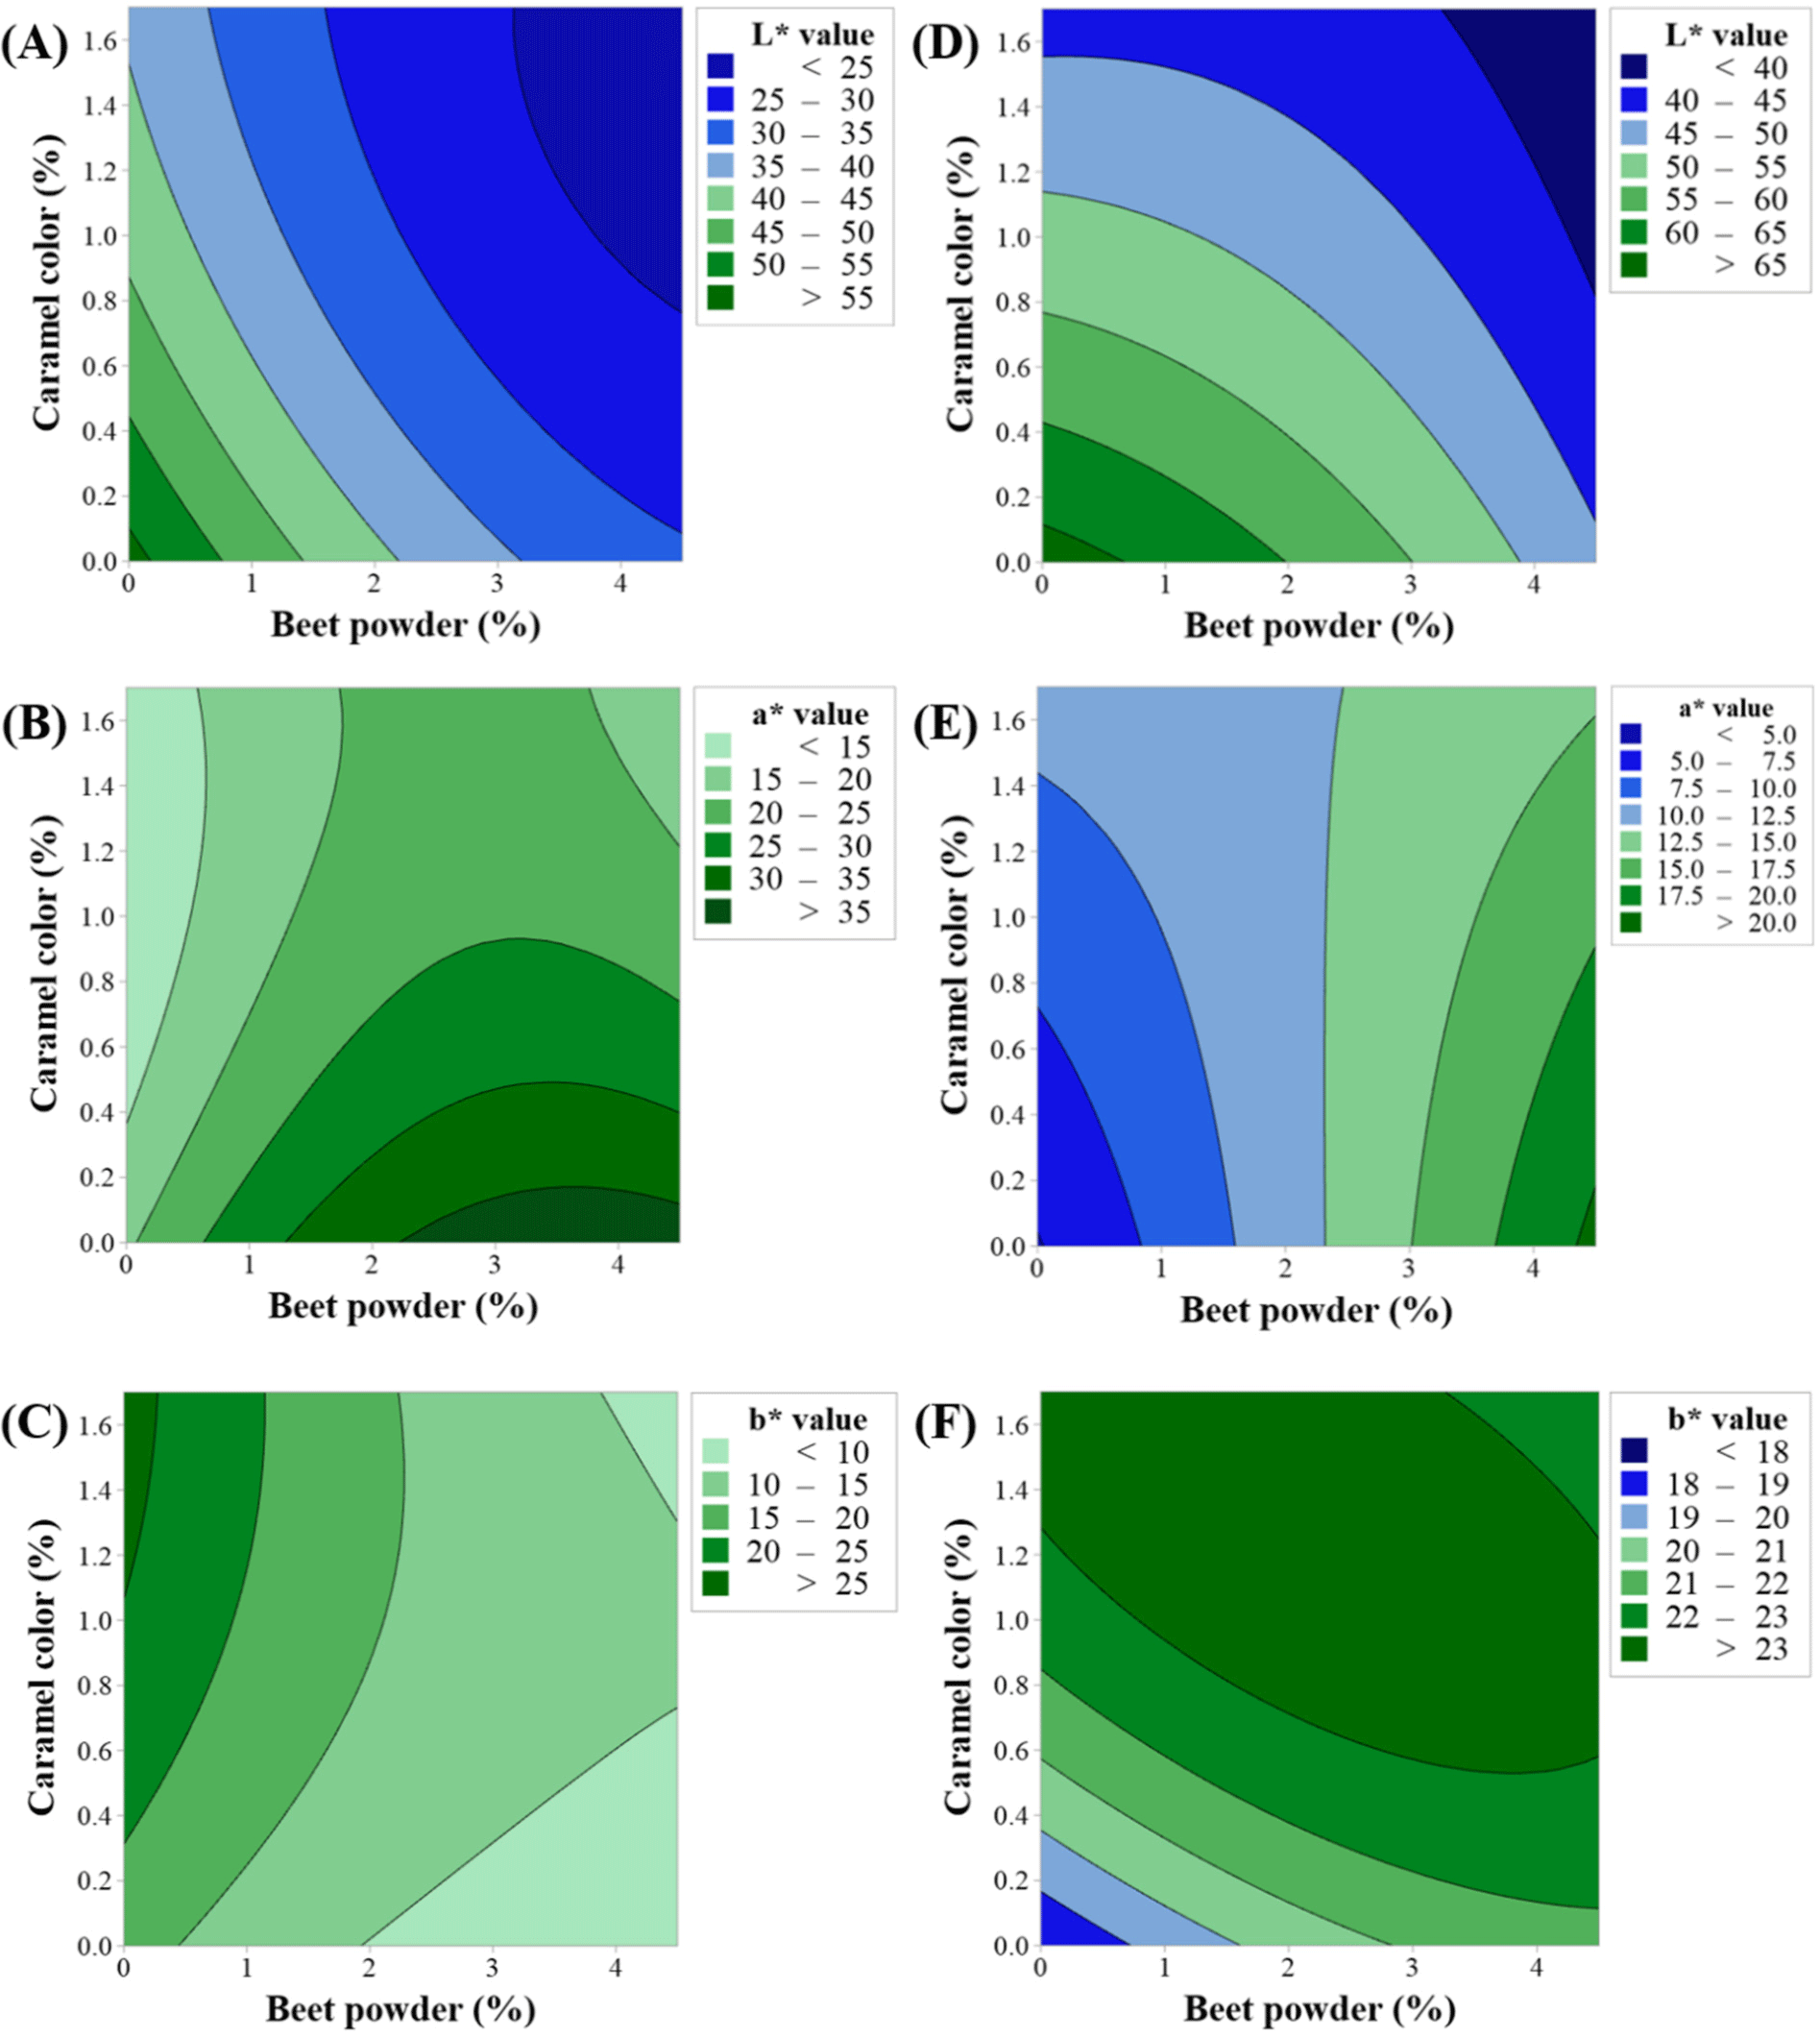
Figs. 2 and 3 show the response surface and contour plots for CIE L*, CIE a*, and CIE b* before and after cooking. The response surface plots showed ridge surfaces. Observations showed that the level of BP had a direct correlation with CIE a* before and after cooking (Figs. 2B, 2E, 3B, and 3E) and CIE b* after cooking (Figs. 2F and 3F). CC had a direct relationship with CIE a* before cooking (Figs. 2B and 3B) and CIE b* before and after cooking (Figs. 2C, 2F, 3C, and 3F). The CIE L* showed an inverse relationship with both the levels of BP and CC (Figs. 2A, 2D, 3A, and 3D).


In RSM, desirability analysis was used to perform the multi-objective optimization considering a total of six responses: before and after cooking CIE L*, CIE a*, and CIE b*. The independent variables BP and CC were employed to optimize the responses by setting the nominal best characteristics as the color of beef. We obtained three solutions with the highest overall desirability. The setting satisfying the highest desirability values close to 1 is considered to be the optimum condition. Table 4 shows three combinations of the BP and CC with the highest overall desirability. Although the overall desirability of 1 was set as the goal (Yolmeh and Jafari, 2017), the six responses that we optimized to simulate BP before and after cooking resulted in overall desirability values between 0.60 and 0.65 for the combined objectives.
| Solutions | BP (%) | CC (%) | Overall desirability |
|---|---|---|---|
| Solution 1 | 1.32 | 1.08 | 0.65 |
| Solution 2 | 1.80 | 1.01 | 0.61 |
| Solution 3 | 1.30 | 1.51 | 0.60 |
Next, the validation of the optimum values was conducted to evaluate the performance properties of the input parameters. A set of experiments was conducted by setting the optimum levels of BP and CC using the same experimental steps to obtain the model, and the output color responses were measured (Table 3). Results showed that the AAD of the patties made by the optimized solutions was below 14%, compared to the predicted values (Supplementary Table S2), indicating that the fitted model successfully predicted the responses. There were no significant color differences between the patties made by the levels of three optimized solutions and real raw beef (p>0.05). This indicates that the optimized levels of BP and CC could well simulate the color of raw beef. However, after cooking, all the color parameters of the three patties had significant differences compared to real cooked beef (p<0.05) except for solution 3 where there was no significant difference between the CIE L* of the patty and that of the real beef (p>0.05). This result implies that the combination of BP and CC could not accurately simulate the color of cooked beef. This might be related to the relatively low desirability (Table 4) for which we had to use six responses during the optimization. Nevertheless, the optimized levels of the three solutions showed similar trends in the CIE L* (increasing) and the CIE a* (decreasing) after cooking. However, the CIE b* of the patties increased after cooking, while the CIE b* of the real beef decreased after cooking. Moreover, as Figs. 1C and D show, the patties that were made by the levels suggested by solutions 1, 2, and 3 exhibited a color appearance similar to real beef. The combination of BP and CC also successfully simulated the color change from red to brown upon cooking, judged by the reduction of the excessive yellow-like-brown color to some degree. A lower CIE a* in the patties compared to beef was probably due to the color offset caused by the increase in the CIE b*, simulating the thermally induced “browning” of beef. In Fig. 1E, the appearance of oven-cooked patties is represented. Solution 3 had the most color similarity to beef, and its CIE L* after cooking showed no significant difference from that of beef. Therefore, considering the results in both the instrumental color and the appearance of the patties, 1.30% of BP and 1.51% of CC can be the optimum condition to simulate beef color.
The use of BP or beet extract to induce the color change of meat analog is limited due to their excessive expression of CIE b*. In Fig. 1, the patties added with BP but no CC also exhibit a purple color before cooking and yellow- or pink-like brown after cooking in both before and after cooking. Hence, a combination of the BP and CC is used to overcome the limitation of beet pigments.
Conclusion
This study aimed at stimulating the thermally induced color changes that beef undergoes during cooking. Combinations of BP and CC were used to replicate the “browning” of beef. Five levels of BP and CC were obtained by the central composite design of RSM. The obtained models for the six responses (CIE L*, CIE a*, and CIE b* before and after cooking) had great accuracy in predicting the response when we monitored the coefficient of determination, p value in lack-of-fit test, residual analysis, and AAD. Using the desirability function, we obtained three solutions for optimized levels of BP and CC: 1.32% of BP and 1.08% of CC, 1.80% of BP and 1.01% CC, and 1.30% of BP and 1.51% of CC. The patties of which color was designed by combining the optimized levels of BP and CC were able to successfully simulate the color of raw beef. However, the cooked patties had different colors when compared with the cooked beef. Nevertheless, the combination of the BP and CC could well simulate the thermally induced increase in the CIE L* and the decrease in the CIE a* caused by cooking. Moreover, the appearances of the patties were also comparable with the beef before and after cooking. Therefore, the combination of 1.32% of BP and 1.08% CC, with the highest overall desirability in this study, can be used to simulate the changes in the beef color from red to brown during cooking.
Meat color depends on several factors, including the animal species, parts or cuts, distribution of the intermuscular fats, muscle fiber types, and quality characteristics of meat (pH and resulting water-holding capacity). Therefore, future studies are required to simulate the color of meat in the meat analogs depending on the target characteristics of the products.


