Introduction
Insects have a rich protein content and are being suggested as a new alternative food source. Although entomophagy, or the consumption of insects, varies depending on the region, humans have already consumed over 2,111 species of insects since the past (Jongema, 2017; van Huis, 2013). Recently, edible insects have been distributed in processed forms, such as protein bars, nuggets, and schnitzels, in European countries. However, there is still a clear aversion to eating insects (Hartmann et al., 2015), and experts have reported that the industrialization of edible insects may take some time because of the risks posed by allergic factors (Jensen and Lieberoth, 2019). However, using insects as animal feed poses fewer aversion and safety issues compared with edible insects. Feed insects can serve as a substitute for traditional feed ingredients, and they may serve as alternatives to grain feed such as soybean and corn, as well as fishmeal (Nogales-Mérida et al., 2018; van Raamsdonk et al., 2017). In the feed market especially, there has been a trend towards reducing the proportion of soybeans used in feed by establishing mixing ratios because of the decrease in crop production caused by global warming (Boerema et al., 2016; Kępińska-Pacelik and Biel, 2022). Edible insects are also being considered fishmeal substitutes in feed because of the scarcity of fishery resources and to reduce feed costs. Nogales-Mérida et al. (2018) reported that many feed insects are among the best alternatives for partially or completely replacing fishmeal because they contain the essential amino acids and fatty acids necessary for aquaculture. Various insect species that can be used as feed are gaining attention because of their potential for mass production. These include larvae of the black soldier fly (Hermetia illucens), mealworm (Tenebrio molitor), supermealworm (Zophobas morio), housefly (Musca domestica), and crickets (Acheta domesticus; van Raamsdonk et al., 2017). They are being developed into feed products for various animals such as pigs (Ji et al., 2016; Veldkamp and Bosch, 2015), poultry (Cullere et al., 2018; Pieterse et al., 2019), fish (Nogales-Mérida et al., 2018; Zarantoniello et al., 2020), and are even used in pet food (Kępińska-Pacelik and Biel, 2022). The possibility of using them as cattle feed has also been discussed (Drewery et al., 2022). Ji et al. (2016) conducted a study on the nutritional composition and efficiency of insect feed. They fed T. molitor,M. domestica larvae, and Z. morio powders as dietary proteins to early weaned piglets and reported that they provided benefits in terms of high amino acid utilization and decreased diarrhea. They also reported that insect feed did not negatively affect the growth rate of early weaned piglets. In addition, Caimi et al. (2020) reported no significant difference in the growth rate of Siberian sturgeon juveniles fed feed mixed with approximately 25% defatted H. illucens powder compared with those fed regular feed.
Insects are animal proteins, but the use of animal proteins as livestock feed has been difficult since the emergence of bovine spongiform encephalopathy (van Raamsdonk et al., 2017). However, regulations regarding feed insects are gradually relaxing in each country and significant industrial growth is expected. In particular, black soldier fly larvae (BSFL) have a lower protein content than other insects, but higher fat and chitin content, making them a valuable feed ingredient. According to Nam et al. (2022) the protein content of BSFL is approximately 40%–43%, while mealworms (T. molitor) have a protein content of 46%–57%, house crickets (Gryllus bimaculatus) range from 58%–60%, and house flies (M. domestica) range from 57%–63%. Additionally, the fat content was reported to be around 28%–30% for BSFL, 24%–37% for T. molitor, 14%–16% for G. bimaculatus, and 7.3%–25% for M. domestica. BSFL can be raised on food waste, which is closely related to the United Nations’ Sustainable Development Goals and corporate Environmental, Social, and Governance goals, because they can also produce valuable vermicompost. Additionally, adult black soldier flies do not have a mouth, so they do not transfer pathogens as other flies (Craig Sheppard et al., 2002). The black soldier fly typically lays approximately 500 eggs and hatches within 4 d, and the larvae decompose organic matter for 14 d (Bessa et al., 2020; Diclaro and Kaufman, 2009).
The black soldier fly farming industry is expected to grow rapidly in the insect feed market; therefore, it is essential to establish a mass-production automation system (Surendra et al., 2020). There are studies related to mass production automation of black soldier flies, such as the study on the automatic breeding system for black soldier flies conducted by Erbland et al. (2021), and it has been reported that Hexafly, Nasekomo (Thrastardottir et al., 2021), and Korea’s CIEF are currently producing black soldier flies in an automated factory format. With recent advancements in computer and sensing technologies, process automation has progressed to smart factorization. In particular, when producing feed insects, the small size of insects and large quantities required for processing make quality control difficult. Failure to manage quality can result in unpleasant odors and mold, which can threaten the quality of the final product (Kępińska-Pacelik and Biel, 2022). In particular, when used as animal or fish feed, it is essential to understand the general nutrient content of each ingredient. Therefore, there is a need for a selection technology that can quickly and accurately evaluate the nutrient content. Spectrometer-based studies of edible and fed insects have also been conducted. Benes et al. (2022) classified flour and seven types of insect powder and separated them. They reported that even mixtures of flour and insect powder could be distinguished with an error rate of 0.65%. Unlike conventional point measurement spectrometers, hyperspectral imaging (HSI) can measure the chemical characteristics of samples as images, making it possible to utilize them for the quality control of heterogeneous products such as food and feed. Furthermore, based on the acquired spectrum, a chemical image can be created, allowing the visualization of the chemical composition of the sample. Cruz-Tirado et al. (2023) used a hyperspectral camera in the range of 928–2,524 nm to determine the individual protein content of BSFL. They developed algorithms using the support vector machine regression (SVMR) and partial least-squares regression (PLSR) analysis methods and reported R2 of prediction set values ranging from 0.731 to 0.773, with root mean square error of prediction (RMSEP) values ranging from 1.567% to 1.664%. Although studies on insect detection in grains and sex determination using HSI have been conducted, as well as on the classification of flour and insect powder, research on monitoring the nutritional components of feed insects for use as feed has not yet been extensively conducted.
The final color of BSFL powder can vary depending on the killing and drying methods (Larouche et al., 2019; Saucier et al., 2022). One of the main reasons for this color change is the oxidation of polyphenols and the formation of complexes between iron and polyphenols during the drying process of BSFL (Janssen et al., 2019a; Janssen et al., 2019b; Larouche et al., 2019). Given that the color of a sample can be influenced by various factors, detection methods in the visible light range may be more sensitive to the color variations of the sample rather than its functional groups, such as -OH and -CH groups. Using a simple RGB camera or a visible/near-infrared (Vis/NIR) waveband range may pose difficulties in evaluating the quality of dried BSFL. Consequently, in this study, a shortwave infrared (SWIR) hyperspectral camera was employed for analysis.
The SWIR camera, operating in the SWIR range (1,000–2,500 nm), demonstrates higher sensitivity to the chemical composition of the sample and is less affected by sample color compared to the Vis/NIR range (400–1,000 nm). Although HSI technology is widely utilized for food quality control, there is a need for optimization and experimental application processes before its installation in sorting machines becomes feasible. Thus, the objective of this study was to develop an algorithm using a SWIR-based HSI system to evaluate the proximate compositions (moisture, crude protein, crude fat, crude fiber, and crude ash) of dried BSFL and to create an optimized model suitable for sorting machines. Ultimately, this study aimed to explore the potential of using HSI for quality monitoring of feed insects based on the algorithm developed.
Materials and Methods
The fifth instar live larvae of the black soldier fly (H. illucens) used in this study were purchased 2 kg from Entomo, a Chung-Ju, Korea. They were divided into nine groups of 200 g each and stored frozen at –20°C until just before the experiment. The experimental design was a 3×3 factorial design with three different drying temperatures (50°C, 60°C, and 70°C) and three different drying times (1 h, 2 h, and 3 h), resulting in nine different treatment groups. Drying was performed using a hot-air food dryer (LD-918BT, Liquip, Hwasung, Korea) with an air velocity of 2.5–3.0 m/s, and the dried samples were vacuum-packed and stored at room temperature (23°C–25°C) in a desiccator until hyperspectral image acquisition. After drying, 20 g of each sample was placed in a Petri dish (Ø 90 mm, 15 mm) for SWIR HSI. The samples were homogenized for 1 min using a grinder (A11 basic, IKA Werke, Staufen, Germany) after imaging. The samples were transported to a chemistry laboratory for proximate component analysis.
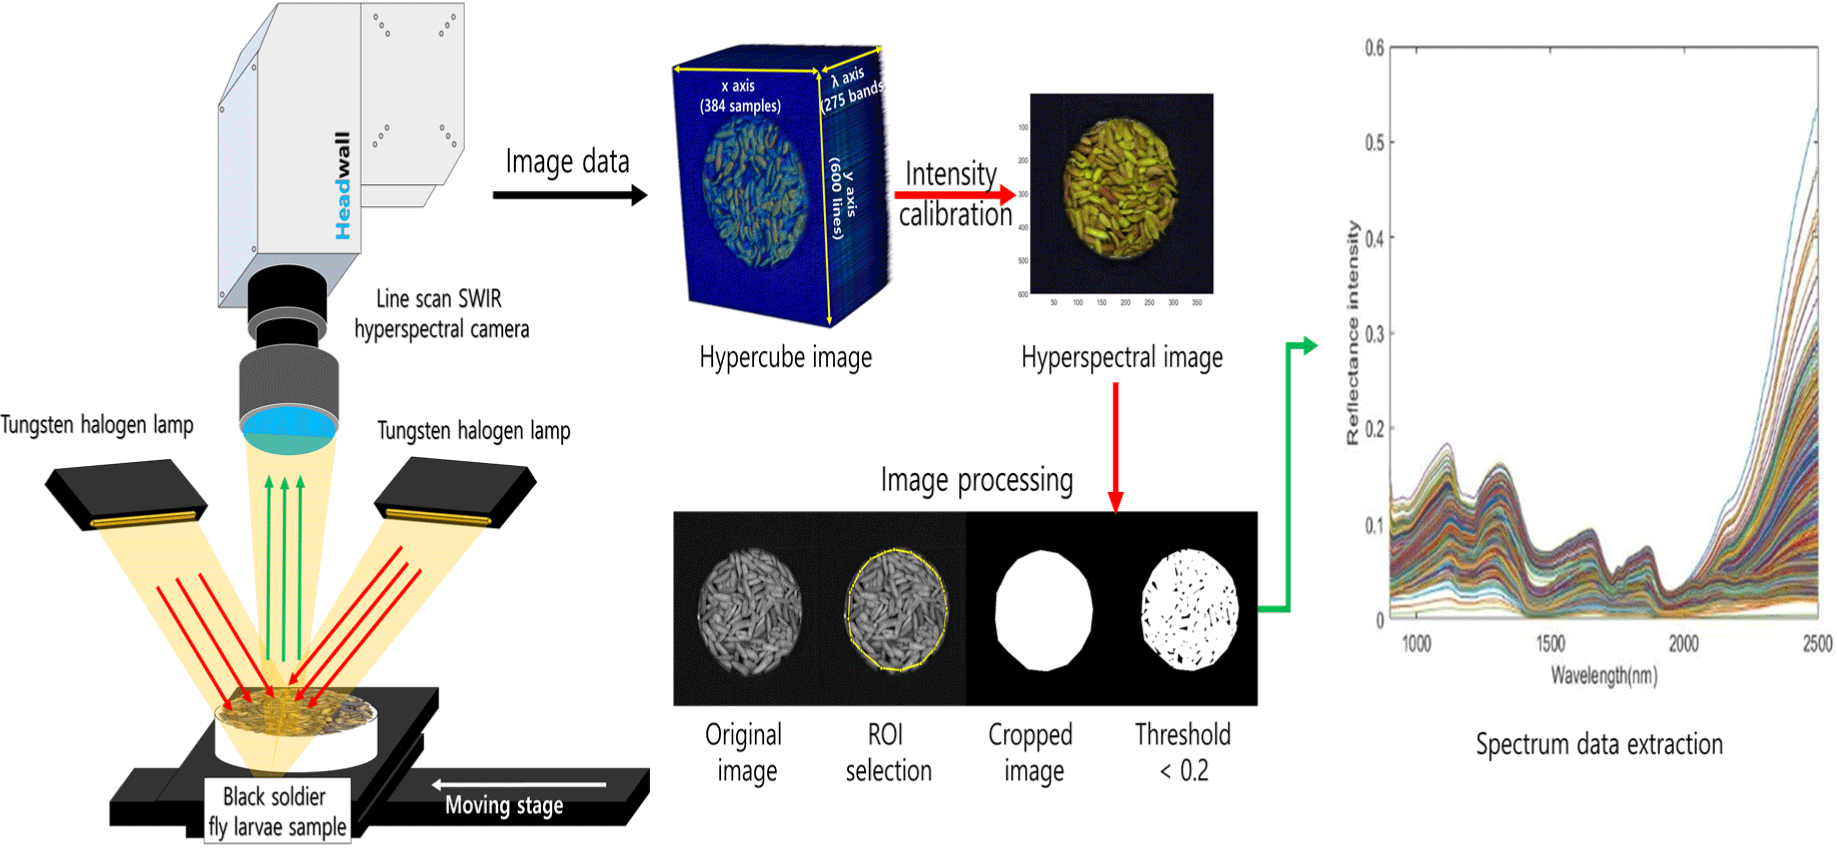
The camera used was a line-scan camera system (Headwall Photonics, Fitchburg, MA, USA) capable of capturing 275 wavelengths ranges of 894–2,504 nm (Fig. 1). Six tungsten-halogen lamps (100 W, 12 V, Light Bank; JCR 12V, Ushio, Tokyo, Japan) connected to fiber optics were used as light sources for imaging. The imaging sample was moved towards the camera using a DC motor-driven movable stage to obtain a hyperspectral image. The speed of the movable stage during the line scan was set at 3.48 mm/s, and the scan range was set to 600 scans/sample. The obtained hyperspectral image was in the form of a 3D hypercube with two spatial coordinates (x- and y-axes) and a wavelength range (λ) dimension, with a final size of 384 (x)×700 (y)×275 (λ). For data analysis, only the wavelength range of 1,000–2,350 nm was used to remove sensor noise, resulting in 232 wavelengths (Fig. 2).
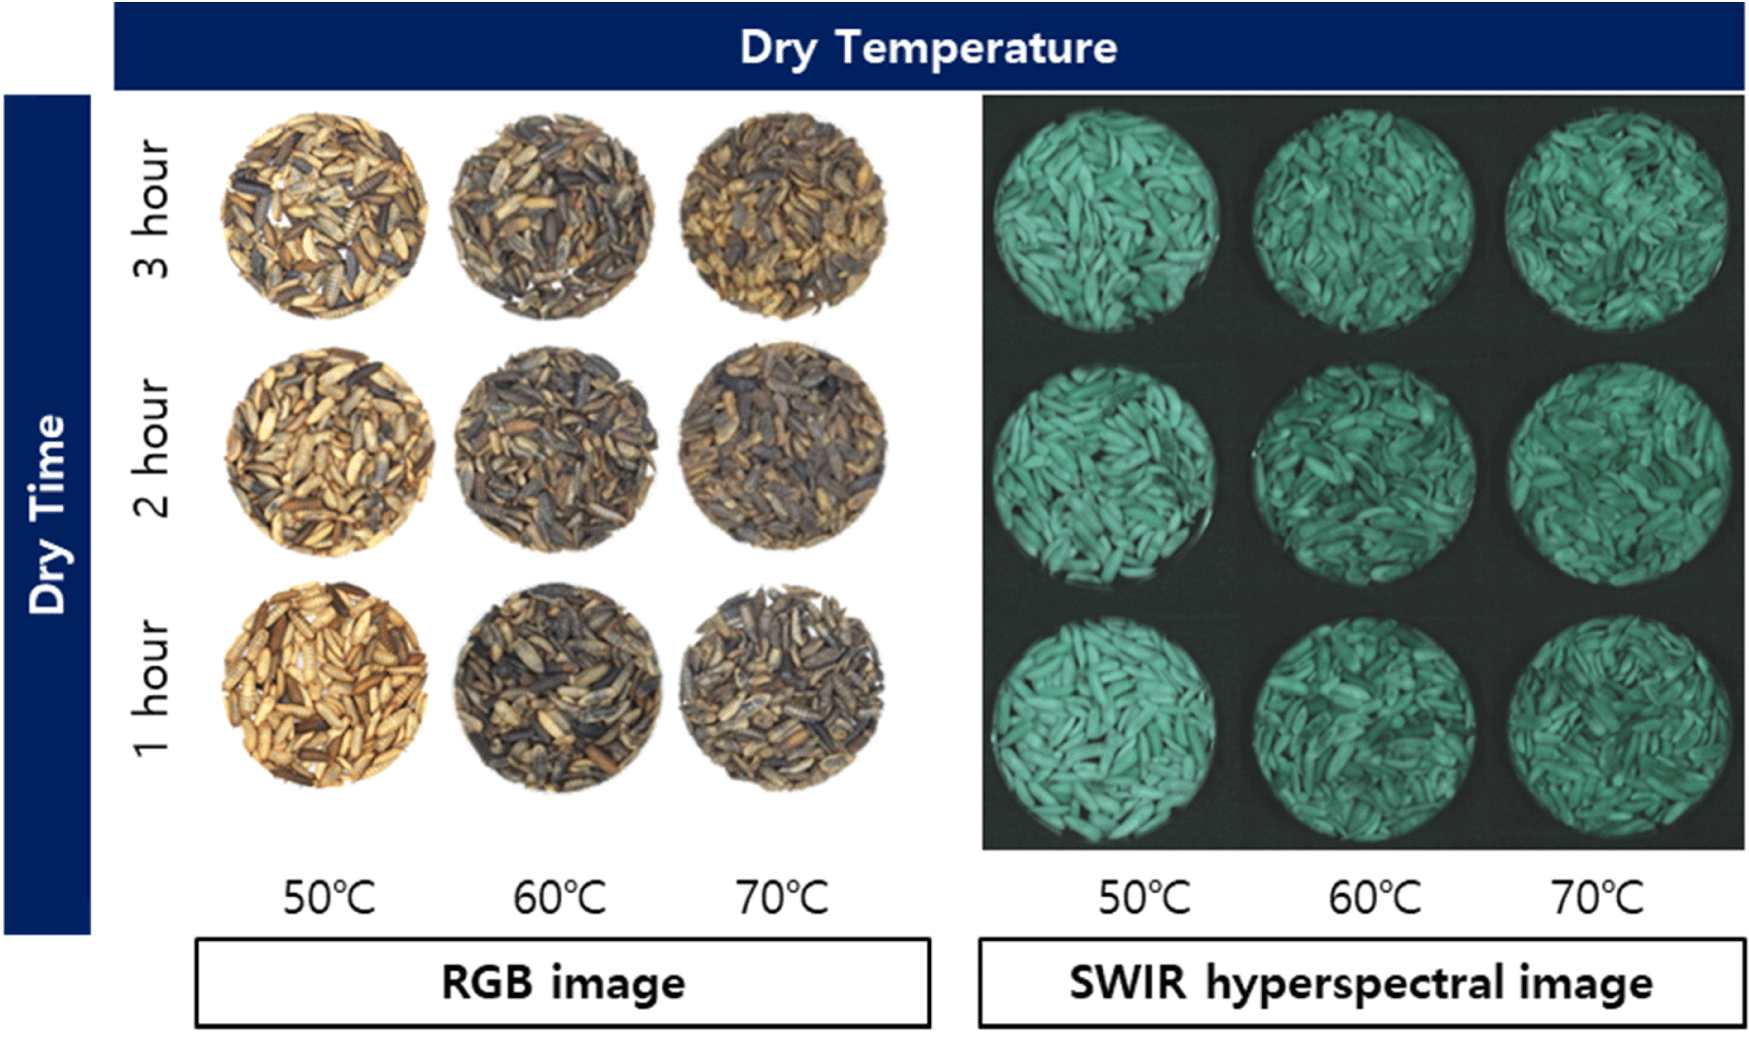
After the HSI process, the samples were ground for a period of 1 minute using a grinding mill (A11 basic, IKA Works). Proximate composition analysis was conducted by repeating the procedure three times, according to the AOAC method (AOAC, 2005). Moisture content was determined by drying the samples (1.0 g) at 105°C for 24 h. The moisture content was calculated using Eq. (1) after 24 h of drying.
The crude protein content was analyzed using the Kjeldahl method. Approximately 0.5 g of each sample was decomposed by adding a catalytic agent (1000 Kjeltabs S/3.5, Foss Tecator, Höganäs, Sweden) and 12 mL of H2SO4. The sample was heated at 420°C for 1 h and cooled. The nitrogen content was measured using a Kjeltec device (Kjeltec auto 2300 Analyzer, Foss Tecator), and the crude protein content was calculated by multiplying the nitrogen coefficient (4.76). Typically, a nitrogen coefficient of 6.25 is used for animal protein. However, there is a possibility of overestimating the crude protein content in insects owing to the presence of nitrogen in chitin. Therefore, recent studies have used a nitrogen coefficient of 4.76 to calculate the crude protein content (Cruz-Tirado et al., 2023; Janssen et al., 2017). The crude fat content was analyzed by ether extraction using a Soxhlet system. Crude fiber analysis was performed using filter bags (Ankom Technology, Macedon, NY, USA), and the difference between the weight of the insoluble residue when treated with 1.25% H2SO4 and 1.25% NaOH solution and the weight after painting was expressed as a percentage of the sample. The ash contents of the samples was analyzed using the combustion method. Approximately 2 g of each sample was heated by electric combustion for analysis. The sample was then placed in a 600°C electric furnace (CT-DMF2, Coretech, Ulsan, Korea) for 2 h. After cooling for 40 min in a desiccator, the sample was weighed to determine the amount of ash present by calculating the difference in weight before and after combustion.
A two-way ANOVA test was conducted to analyze the significant differences in the biochemical composition results of the sample according to the drying time and temperature, and the interaction p-value was calculated for both drying time and temperature. A one-way ANOVA test was conducted again for each drying time and temperature, and a post hoc analysis was performed using Duncan’s multiple range test for samples with significant differences (p<0.05). Basic statistics were obtained using the R statistical program (version 4.1.2, The R Foundation, Ames, IA, USA), with the CRAN mirror set to the USA (CA1) and ‘Agricolae’ libraries.
To mitigate the influence of external environmental factors, such as dark current noise and non-uniform lighting, spectral intensity calibration was conducted. For this purpose, white and dark references were acquired during image acquisition. The white reference was obtained using a white Teflon board (99.5% reflectance, 30 cm×30 cm×1 cm), whereas the dark reference was obtained by closing the camera lens cap and capturing an image with the light source turned off. The intensity calibration of the acquired hyperspectral image was performed using Eq. (2).
where represents the spectrum of the sample at the pixel, represents the spectrum value of the dark reference image, and represents the spectrum of the white reference. The final Xc value represented a pixel-wise intensity-calibrated hyperspectral image, which is a relative intensity spectral image. Finally, the wavelength is extracted from the processed hyperspectral images.
The calibrated image was used to extract spectra by selecting the region of interest, and a masking image was created by setting the threshold value to 0.2 to select only the sample area. The masking image was then multiplied by all wavelength images to separate only the sample area of the spectrum (Fig. 2). The spectrum was extracted from all the pixels of the separated sample area and averaged to obtain the mean spectrum. Ten average spectra were extracted for each sample image, and 600 sample spectra were obtained and used for the subsequent multivariate analyses.
The acquired spectral data contain considerable noise. Many external factors, such as baseline correction, band shift, and light scattering, hinder the acquisition of pure data, and spectra preprocessing is usually performed for noise removal during the analysis. Normalization and deviation methods are commonly used for preprocessing. As there is no single best preprocessing technique, this study utilized Seven preprocessing methods to pre-process the acquired wavelengths. Three normalization methods (minimum, maximum, and range normalization), standard normal variate, multiplicative scatter correction (MSC), Savitzky-Golay 1st derivation, and Savitzky-Golay 2nd derivation were used in the spectral preprocessing process in this study.
PLS-R is a multivariate analysis method used to evaluate the correlation between various independent variables X and a dependent variable Y (Wold et al., 1984). PLS-R was used to predict the dependent variable Y using a regression equation. The PLS method used in this study is described by Eqs. (3) and (4). The PLS regression equation generates a regression model using the spectral data (X matrix, N samples×K wavelengths) and acquired parameter values as a reference (Y matrix, N samples×1).
In this context, Y is a matrix of dependent variables representing moisture, crude protein, crude fat, crude fiber, and crude ash content in the BSFL. X is an n×p matrix of independent variables corresponding to each spectral variable, where n is the number of spectra in the sample and p represents each wavelength range (nm). Matrix X is composed of a loading matrix P, a score matrix T, and an error matrix E. Matrix Y is composed of a loading matrix Q, a score matrix U, and an error matrix F. To develop a regression model, 70% of the 600 data points were randomly assigned to the calibration set, and the remaining 30% were assigned to the validation set during the spectrum analysis. Finally, 420 and 180 data points were included in the calibration and validation datasets, respectively.
In this study, root mean square error (RMSE) was used to calculate the model’s error rate (Lee et al., 2013). The formula for calculating RMSE is shown in Eq. (5).
Here, yi,actual and yi,predicted represent the actual reference values obtained through chemical experiments and the estimated predicted values from the developed PLS model, respectively. In addition, ‘n’ represents the number of actual samples. The model results were expressed as the coefficient of determination (R2), which was calculated using Eq. (6).
One advantage of HSI is its ability to generate chemical images of component distributions by simultaneously measuring spectral and spatial data (Faqeerzada et al., 2020). The beta coefficients obtained through the PLS-R analysis were used to generate a chemical image of the sample. In this process, the hyperspectral image was transformed into a 2D matrix, which was then multiplied by the PLS regression coefficients. The resulting 2D matrix was then transformed back into a 3D image, and the PLS chemical image was generated by summing the corresponding pixels of all band images. The chemical formula is given in Eq. (7):
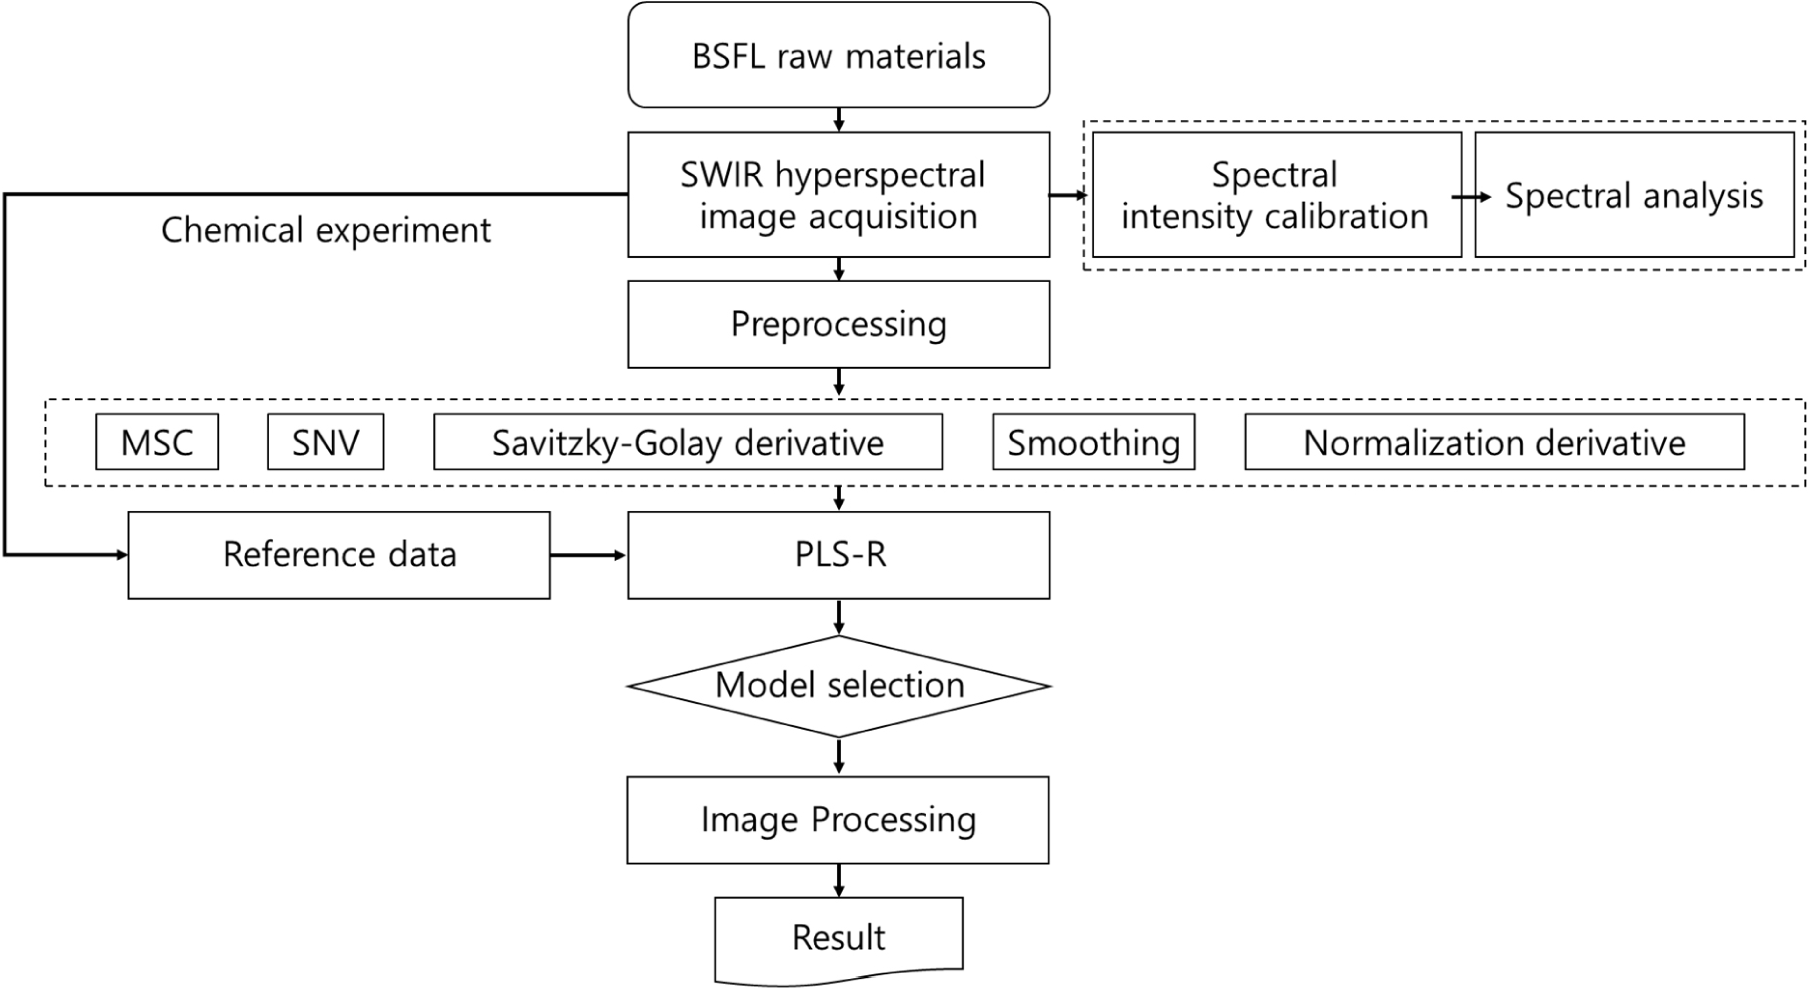
where Ii represents the hypercube image measured at the ith wavelength band, Ri represents the beta coefficient values derived from the PLSR model, and C represents a constant. n denotes the number of wavelengths used in this study. All analyses and visualizations related to the wavelengths were performed using MATLAB 2021b (MathWorks, Natick, MA, USA). Fig. 3 shows the experimental flow.
Results and Discussion
Table 1 shows the proximate component analysis results for the dry matter (DM) of BSFL. The moisture content of the larvae decreased significantly with increasing drying time and temperature (p<0.05). The moisture content decreased the most at 70°C during drying. In this study, the larvae were dried at 70°C for 3 h, which was generally considered to be the end of the drying process, and the moisture content of the treatment group was found to be about 14.4%. Chia et al. (2020) reported that the moisture content of BSFL was around 9%–12%. The crude protein content of the larvae increased gradually with increasing drying time and temperature, and this increase was more significant at higher temperatures (p<0.05). In this study, the highest crude protein content (26.2%) was observed in the treatment group dried at 70°C for 3 h. Generally, the protein content of BSFL powder is reported to be approximately 30%–52.9% (Bessa et al., 2020), and Chia et al. (2020) reported that the protein content of BSFL was approximately 31.7% when fed agricultural byproducts. This study showed similar results to those of previous studies.
Temp: p-value of the dry temperature; Time: p-value of the dry time; Inter (T1×T2): interaction p-value of the dry temperature with the dry time. * p<0.05, ** p<0.01, *** p<0.001.
The crude fat content also increased from 30.1% to 46.2% with increasing drying time and temperature (p<0.05). As the moisture content decreased, the increasing trend in the proximate components in the samples led to an increase in the g/100 g protein and fat percentages, which in turn increased the total crude protein and fat content. In this study, the fat content was about 46.2% in the sample dried at 70°C for 3 h, which was considered the end of the drying process. Chia et al. (2020) reported that the fat content of BSFL varied depending on the feed (p<0.0001) and ranged from 9.5% to 49.0%. Caligiani et al. (2018) analyzed BSFL using the Soxhlet ethyl ether extraction method and reported a fat content of approximately 37.1%. Li et al. (2022) reported that fat content varied depending on the diet of the larvae. The crude fiber content (%) showed a gradual increase with increasing drying time at 60°C and 70°C, except for the 50°C dry treatment group. In this study, the crude fiber content increased significantly from 2.7% to 6.8% at the end of the drying process (p<0.05). Park et al. (2013) reported that the crude fiber contents of BSFL and pupae were 7.47% and 7.63%, respectively. In this study, the crude fiber content of BSFL significantly increased with increasing drying time and temperature (p<0.05) and reached 6.4% after drying for 3 h at 70°C. Park et al. (2013) reported that BSFL’s DM crude fiber content was about 9.41%, and Chia et al. (2020) reported a crude fiber content range of 6.7%–12.1%. In conclusion, as the drying time increased in this study, the moisture content decreased, and the amounts of crude protein, crude fat, crude fiber, and ash increased. Furthermore, the results were within a range similar to those reported in other studies.
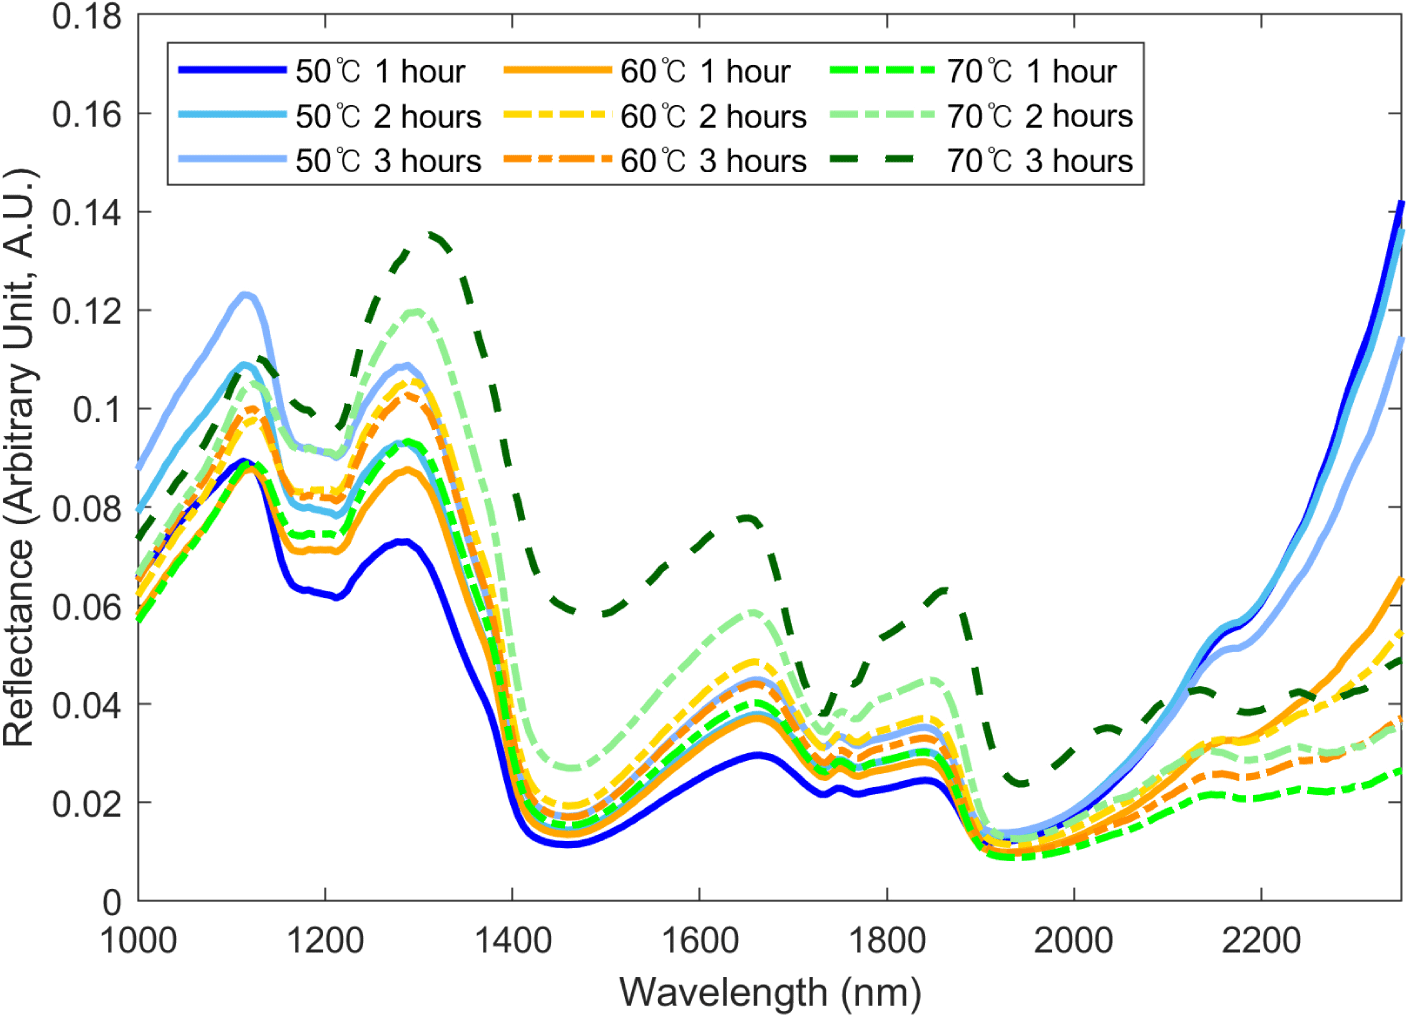
Fig. 4 shows the SWIR hyperspectral spectral data of the BSFL. Each spectrum shows the average spectrum of the group according to drying temperature and drying time. It was confirmed that the wavelength intensity and pattern changed with drying time and temperature within a specific wave range. These results suggest the possibility of a proximate composition prediction using the wavelength of BSFL in the SWIR region. The average spectrum can be used to observe the overall spectrum pattern for each group by comparing the approximate spectral differences between the groups through spectrum intensity and shape differences. However, spectrum intensity can have a high SD owing to noise factors such as spectrum shifts, making it more practical to compare spectrum patterns rather than spectrum intensity (Park et al., 2021). In the case of Fig. 4, it is difficult to confirm the trends owing to spectrum shifts. Therefore, instead of comparing the spectral intensity using methods such as ANOVA, we aimed to build a proximate component prediction regression model for each group by conducting PLS-R analysis.
The results of the proximate component prediction model for the BSFL are listed in Table 2 and Fig. 5. The predicted results for moisture content showed a range of R2P 0.96–0.98 and an RMSEP range of 1.83%–2.59%. The preprocessed model showed higher results than when using raw spectra, with the highest results shown in the model that underwent maximum normalization (R2P=0.98, RMSEP=1.83%). To date, no studies have been conducted on the development of algorithms to predict the proximate component contents of edible or feed insects. However, the accuracy of the model can be verified by comparing it with similar experimental results. Yu et al. (2019) used a Vis/NIR hyperspectral camera to analyze the moisture content of beans using the PLSR method, with 12 wavelengths and showing Rp=0.966 and RMSEP=5.105%. Huang et al. (2014) conducted an experiment to monitor the change in moisture content of beans over drying time using Vis/NIR, showing Rp values of 0.901–0.973 and RMSEP values in the range of 4.6%–9.2%. The results of the moisture prediction model exhibited an appropriate level of accuracy.
SWIR, short wavelength infrared hyperspectral imaging system; Mean norm, mean normalization; Maximum norm, maximum normalization; Range norm, range normalization; MSC, multiplicative scatter correction; SNV, regular normal variate; SG 1st, Savitzky-Golay 1st derivation; SG 2nd, Savitzky-Golay 2nd derivation; Raw, raw spectrum; RC2, coefficient of determination of calibration set; RMSEC, root mean square error of calibration set; RP2, coefficient of determination of prediction set; RMSEP, root mean square error of prediction set; LV, latent variables.
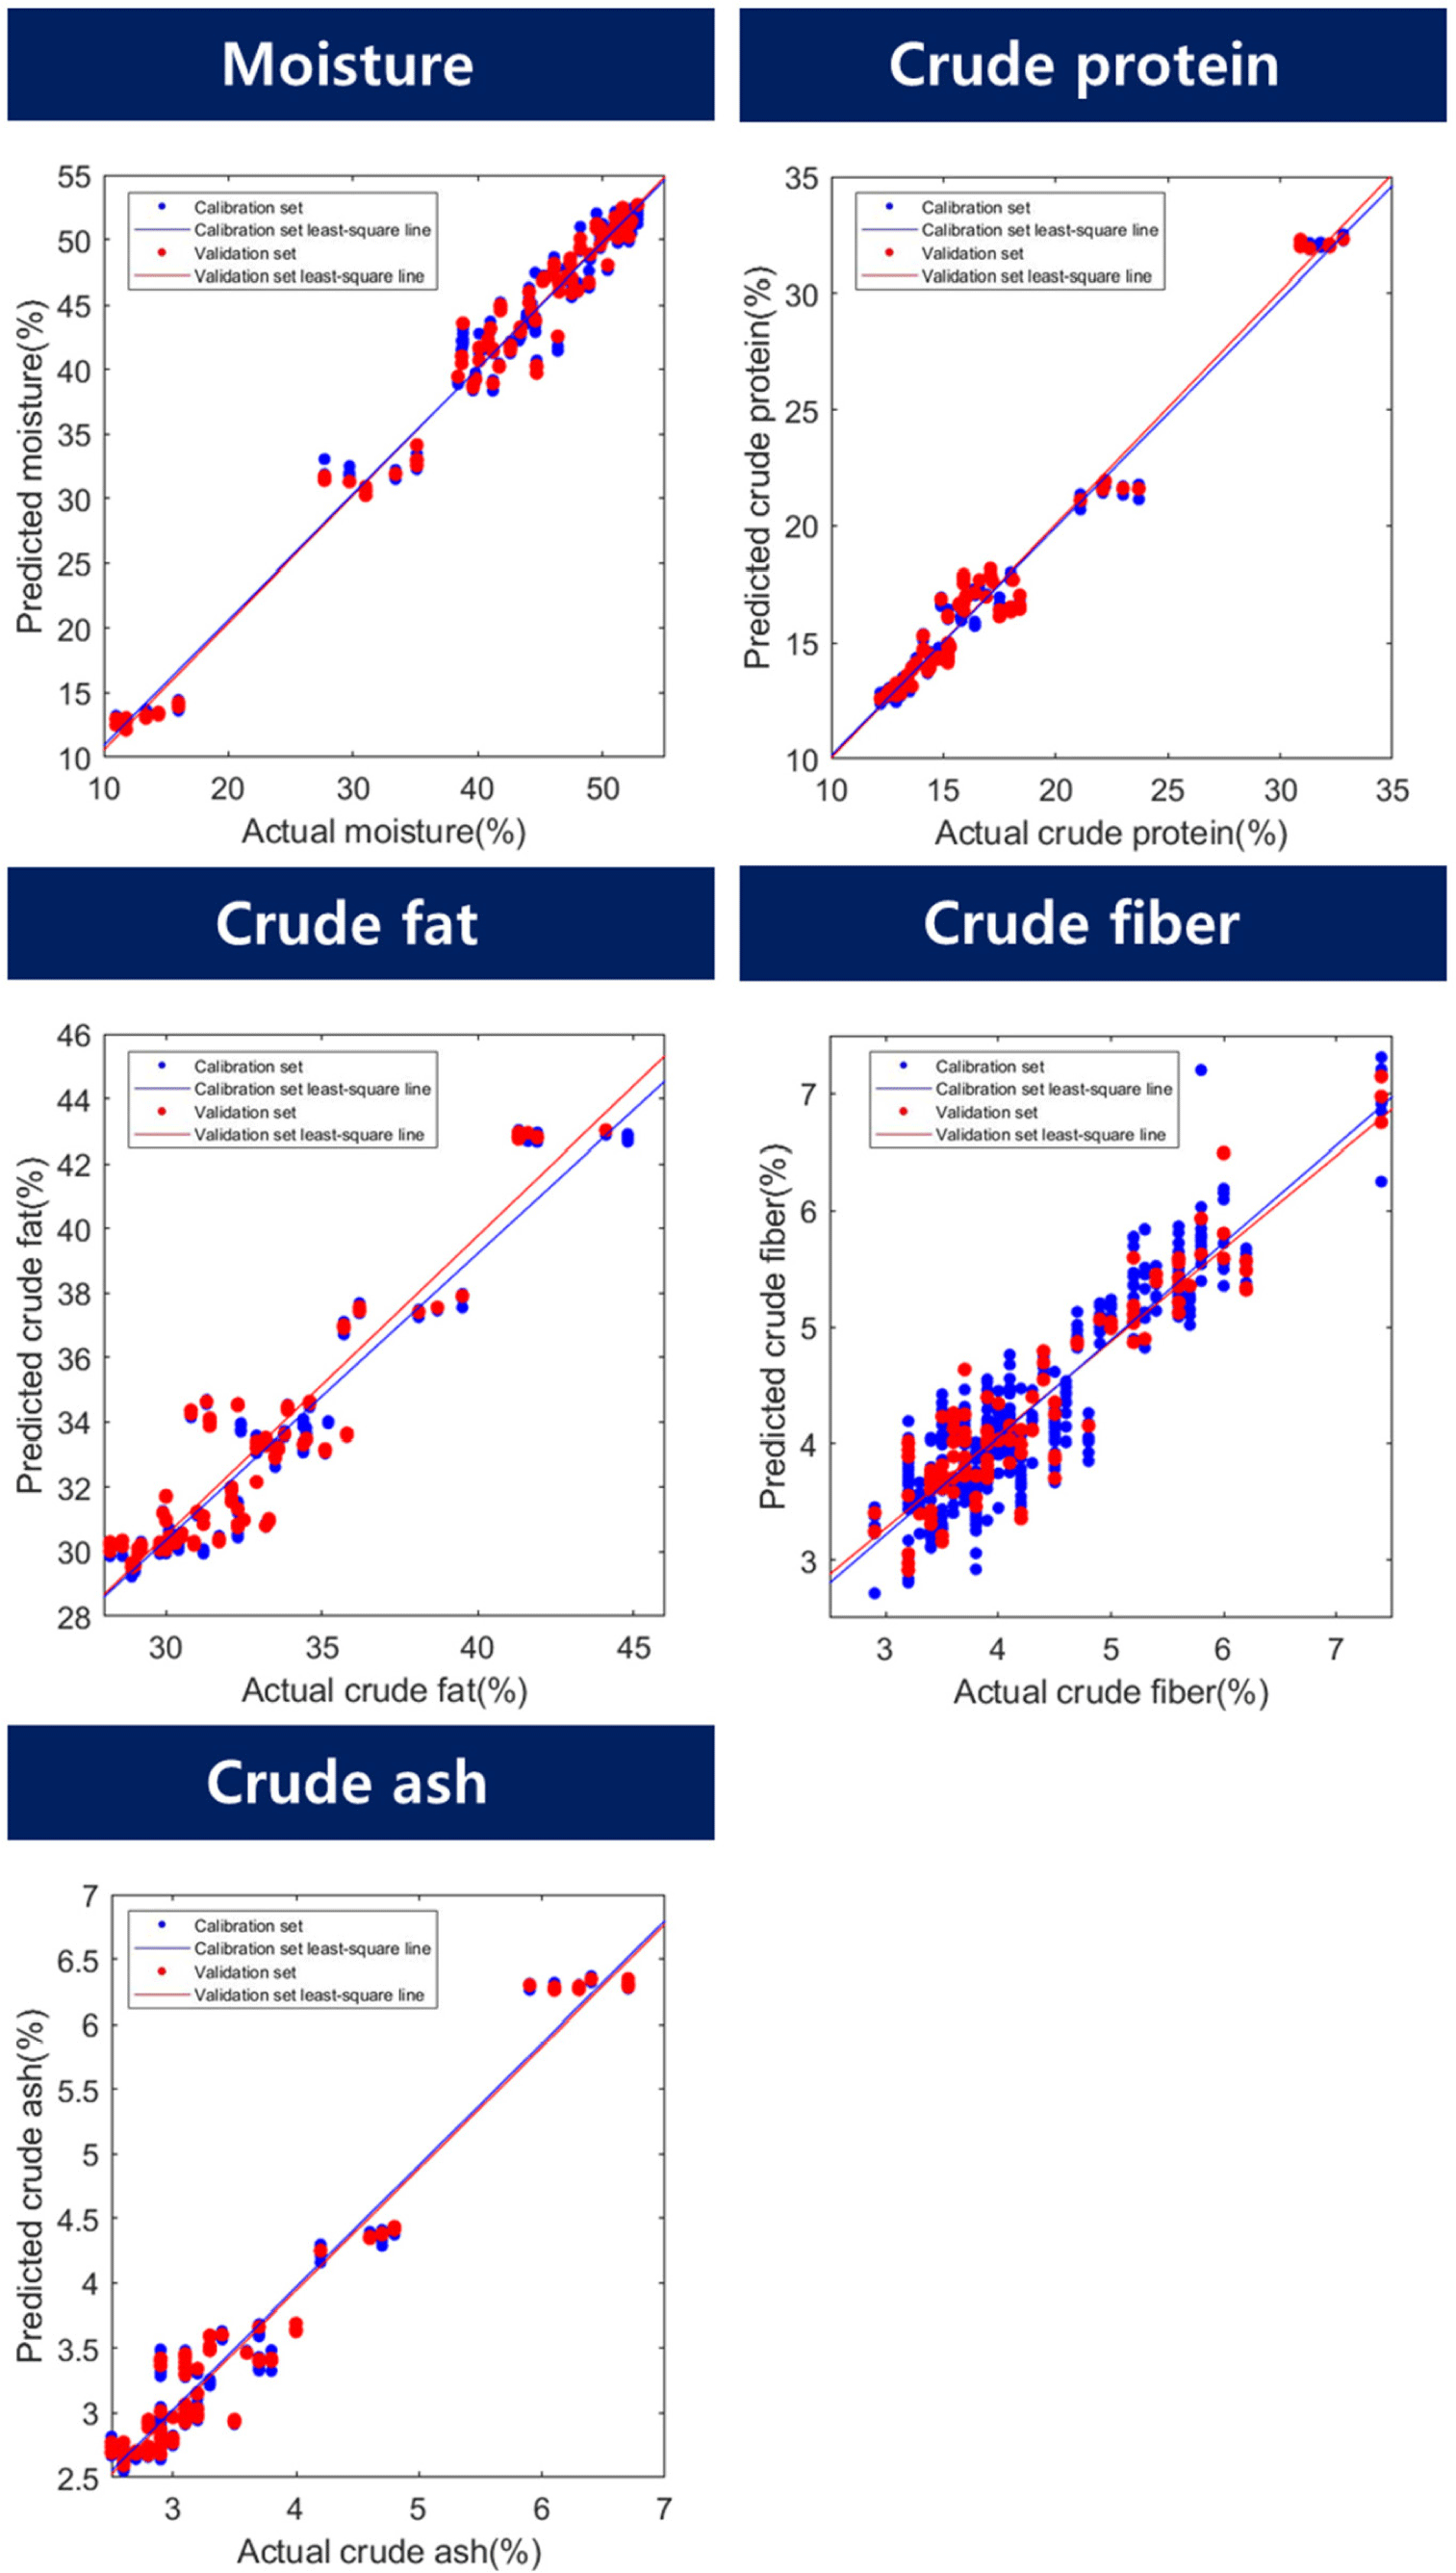
Fig. 6 shows the beta coefficients of the predicted model. In general, if the beta coefficient is high or low, the model should be weighed. In this moisture content prediction model, the wavelengths of 1,077, 1,165, 1,224, 1,347, 1,412, 1,741, and 1,882 nm were determined to have weights. Wavelengths related to -OH groups significantly impact model construction in predicting moisture content. Gergely and Salgó (2003) studied three absorption wavelength regions of water and concluded that the ranges of 1,890–1,920 nm, 1,400–1,420 nm, 1,150–1,165 nm, and 1,000–1,100 nm were related to moisture. Among them, the 1,150–1,165 nm range was reported to be a combination of the first overtone of the O-H stretching and bending bands at 1,165 nm. Furthermore, 1,425 nm is known as the first overtone region of the -CH and -OH bonds. In this study, it was determined that the wavelength in the 1,412 nm region helps predict moisture content, and it is also believed that factors in this region contribute to this effect. According to Barbin et al. (2013), the 1,400–1,600 nm wavelength range is known as the stretching region of -OH and -NH. The peak observed in the 1,412 nm region in this study is believed to be a signal generated by this overtone. Williams and Norris (1987) reported that the wavelength range of 1,414 nm, which is similar, is the O-H stretch first overtone. The wavelengths of 1,077, 1,224, and 1,347 nm detected in the range of 1,000–1,350 nm are signals generated by -CH bonding (Bobasa et al., 2021; Hoffman et al., 2023). The 1,080 nm region is known as the -CH bonding region (Muradov and Sannikov, 2007), and the 1,077 nm region is considered similar to the -CH bonding region. Kucha and Ngadi (2020) reported that a wavelength of 1,224 nm, which is close to the -CH overtone region in the 1,220 nm range, can be used to detect lipids or fatty acids. The overtone region of the -CH bonding contributes to the prediction of moisture content because the proximate compositions of the sample are interdependent, and their percentages add up to 100%. Therefore, when the moisture content decreased, the percentage of lipids in the sample increased, which was detected as a weight in the moisture content prediction. Holman and Edmondson (1956) explained that the strong bands around 1,740 and 1,770 nm in their study of pure fatty acids and triglycerides were derived from the C-H vibration of CH2 groups. The first overtone peak, 1,880 nm, is known as the absorbance of water and ester (Koumbi-Mounanga et al., 2015). The wavelengths detected at 1,741 nm and 1,882 nm are believed to be generated by the corresponding components.
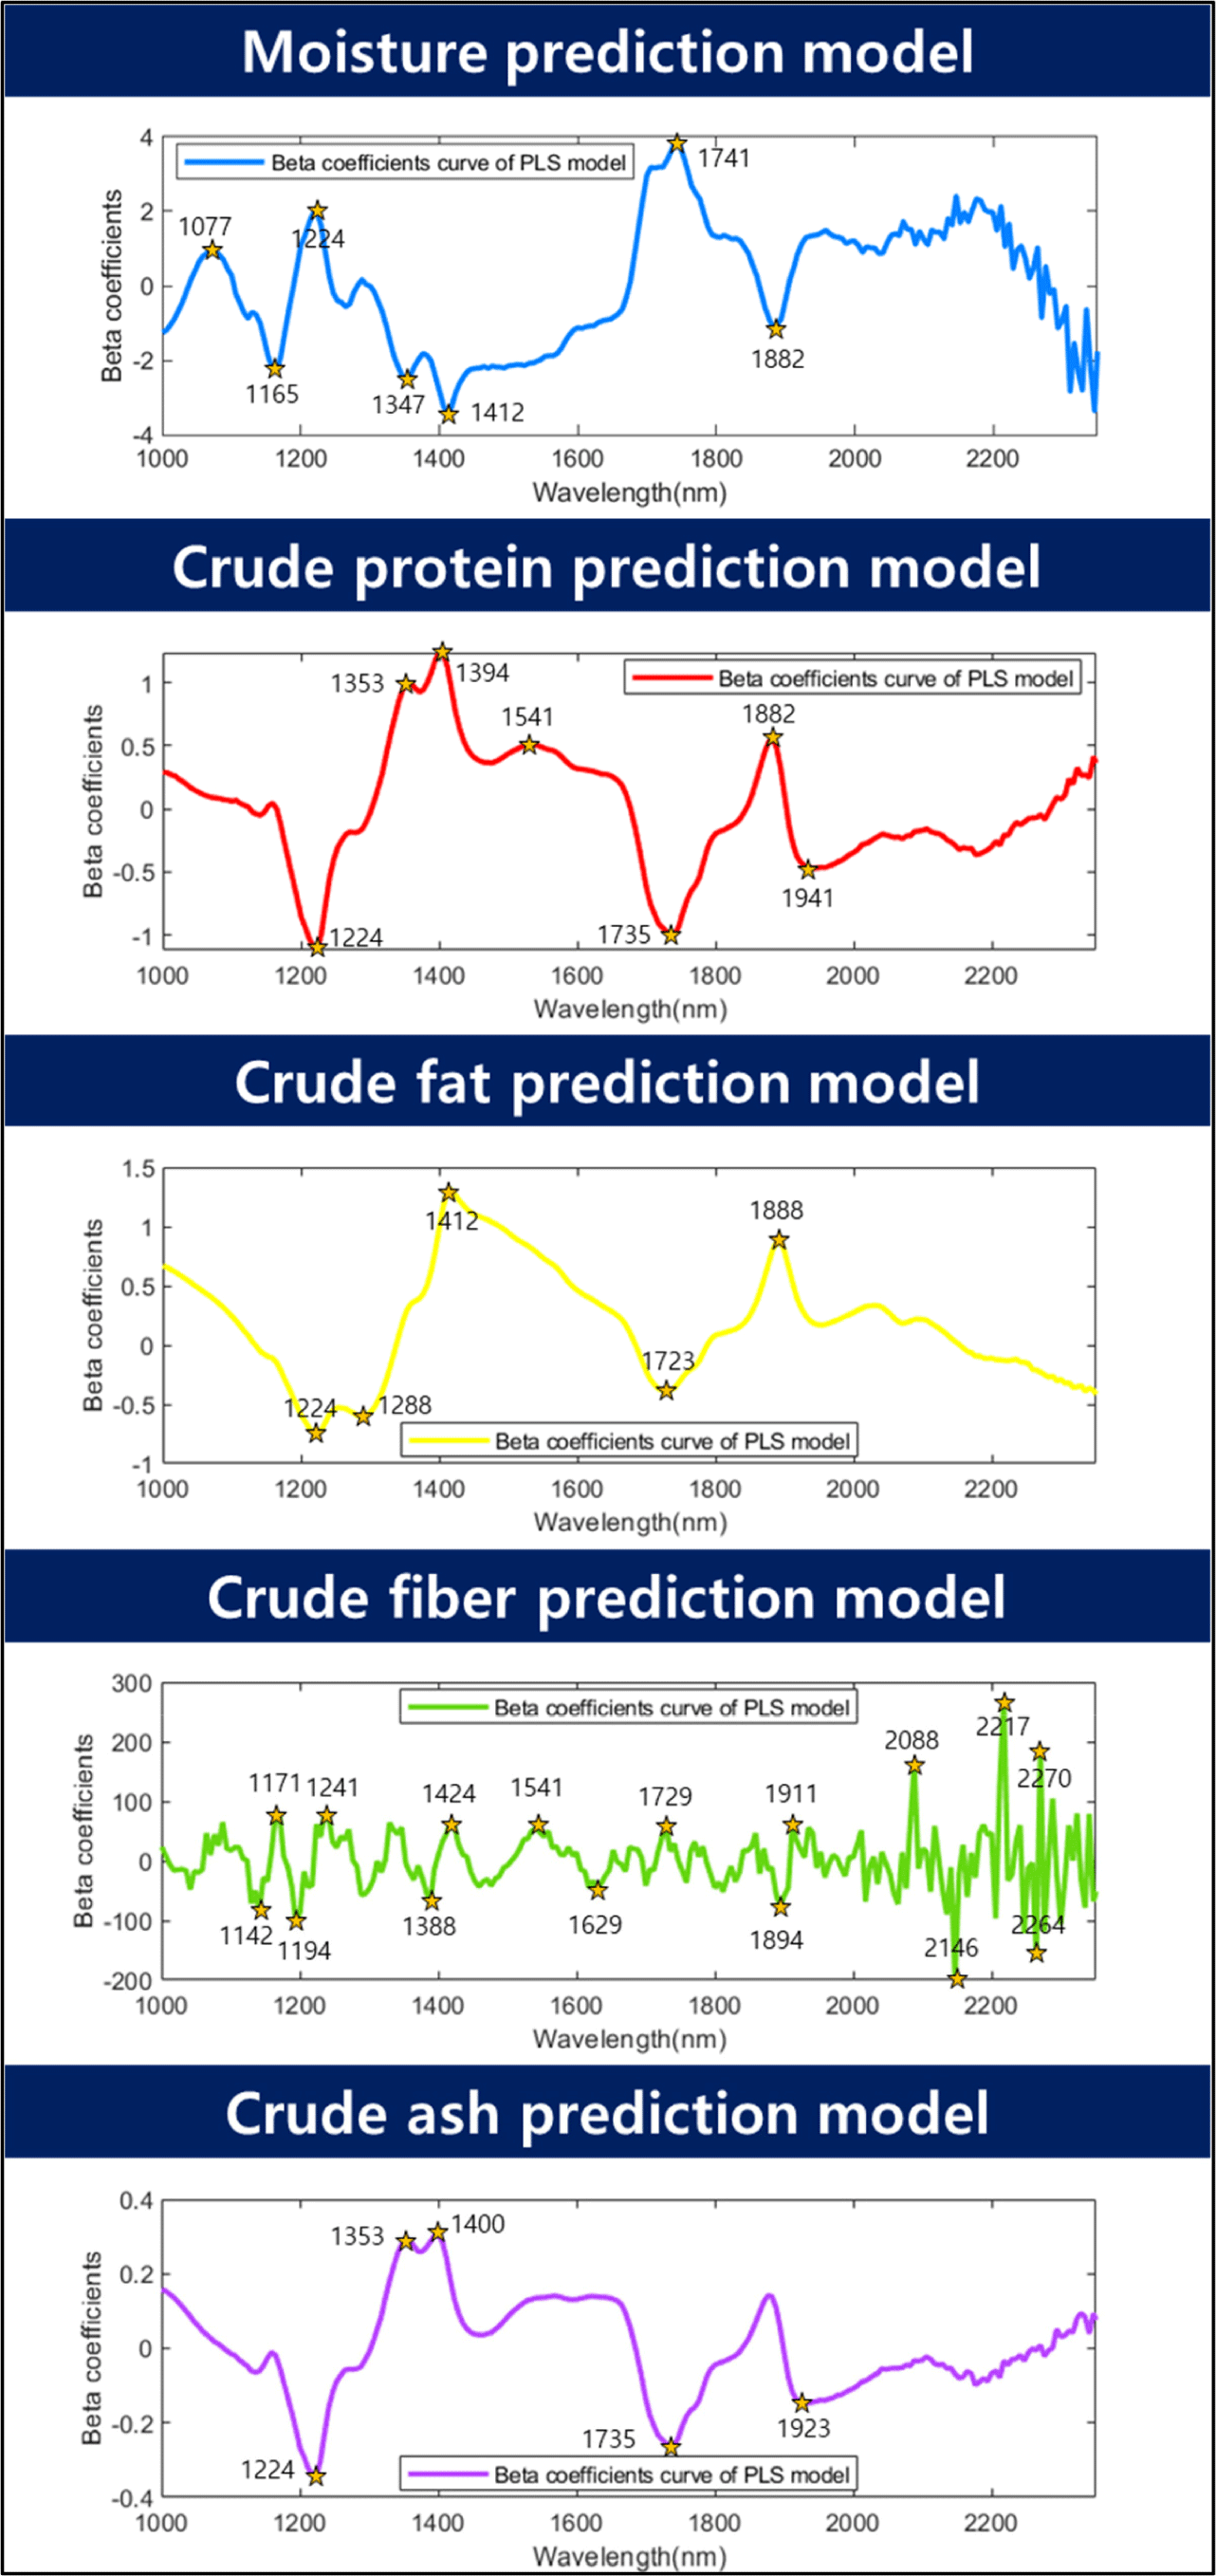
For crude protein, the R2P values ranged from 0.95 to 0.99, and the RMSEP values ranged from 0.55% to 0.99%. The maximum normalization method exhibited the highest accuracy (R2P=0.99, RMSEP=0.55%). Cruz-Tirado et al. (2023) conducted an experiment to predict the protein content in individual BSFL using a NIR spectrometer. They constructed a model using SVMR and PLSR. They reported R2p values ranging from 0.731 to 0.773 and RMSEP values ranging from 1.57% to 1.66%. In this study, the authors attributed the low performance to the difficulty in accurately predicting the components owing to the overlap of the chitin signal with the protein signal. In contrast, the current study demonstrated a relatively high accuracy and low RMSEP compared to the previous study, which may be attributed to the inclusion of additional wavelength information for predicting moisture, crude protein, and crude fat content in the model. The beta coefficients for crude protein were 1,224, 1,353, 1,394, 1,541, 1,735, 1,882, and 1,941 nm. Wavelengths of 1,224, 1,353, and 1,735 nm were used to predict -CH in this case (Bobasa et al., 2021; Hoffman et al., 2023). Cruz-Tirado et al. (2023) constructed a principal component (PC) model to predict proteins in BSFL and detected 1,760 nm in PC1, which they reported to be the necessary wavelength for predicting fatty acids. In the current study, although there was a slight difference in the wavelength, the wavelength range of 1,735 nm was assumed to be a signal from the -CH bond because of its similarity to the necessary wavelength reported by Cruz-Tirado et al. (2023). In addition, wavelengths of 1,394 and 1,541 nm were also detected in the beta coefficients for moisture content and belonged to the overtone regions of -NH and -OH, which are overlapping wavelengths for predicting crude protein. Furthermore, 1,882 nm was considered to be the beta value associated with -OH. According to Cruz-Tirado et al. (2023), the signal at 1,900 nm is assumed to originate from -NH, and the signal at 1,941 nm is considered to originate from this -NH region.
According to the study, the prediction of the crude fat content showed an R2P range of 0.87–0.91 and an RMSEP of 1.34%–1.67%, and the best performance was achieved by mean normalization (R2P=0.91, RMSEP=1.34%). According to Caporaso et al. (2021), the SD of the AOAC method 922.06 for fat content analysis by acid hydrolysis ranges from 0.7% to 7.5% depending on the type of food analyzed. Therefore, the model prediction results of this experiment are considered to be applicable to nondestructive tools. The beta coefficients for fat content were 1,224, 1,288, 1,412, 1,723, and 1,888 nm. The peaks at 1,224, 1,288, and 1,723 nm are associated with the overtone region related to -CH. Choi et al. (2021) stated that this region constitutes fat-and fatty acid-related areas in the wavelength range of 1,600–1,800 nm. In addition, 1,412 nm and 1,888 nm were identified as the regions associated with -OH. The reason why the wavelength associated with –OH (1,412, 1,888 nm) was detected as an important wavelength for crude fat prediction is that the content of the proximate composition is calculated in %. When the moisture content of a proximate composition decreases, the % unit of other crude protein and crude fat, which are relatively reference values, increases. Based on this result, it is judged that the wavelength region related to moisture also affects the construction of the crude fat model.
The R2P of the crude fibers ranged from 0.85 to 0.89, and the RMSEP ranged from 0.46% to 0.53%. In terms of latent variables (LV), crude fiber showed a diverse range of 14–17 LVs, indicating that the model is complex compared with other models for proximate composition. Among the preprocessing models for crude fiber, the model with mean normalization exhibited the highest accuracy (R2P=0.89, RMSEP=0.46%). The beta coefficients for the crude fiber model in Fig. 6 show that 16 wavelengths (1,142, 1,171, 1,194, 1,241, 1,388, 1,424, 1,541, 1,629, 1,729, 1,894, 1,911, 2,088, 2,146, 2,217, 2,264, and 2,270 nm) were relatively important peaks compared to other wavelengths. Chitin is a representative example of a major component of crude fiber. Chitin is a polysaccharide structure composed of multiple N-acetyl-D-glucosamine molecules containing nitrogen. The exoskeletons of insects and crustaceans, including BSFL, are composed of chitin. Brigode et al. (2020) conducted a study to evaluate the properties of biopolymer films produced using chitin from BSFL. And also this chitin can be applied to making other functional materials like chitosan. Chitosan can be obtained due to the deacetylation of chitin, has antibacterial properties against fungi and bacteria, and can be used to reduce the use of antibiotics in animals (Riaz Rajoka et al., 2020). Typically, the chitin content of black soldier fly prepupae is reported to be approximately 9%–10% (Soetemans et al., 2020). Cruz-Tirado et al. (2023) reported that the regions at 2,150 nm, 2,256 nm, and 2,337 nm are associated with chitin content and are connected with 2×amide I+2×amide II, O-H stretching+O-H deformation, and C-H stretching+C-H deformation (Cruz-Tirado et al., 2023; Osborne, 2006; Shetty et al., 2012). Cruz-Tirado et al. (2023) estimated that the 2,000–2,500 nm range is associated with chitin. Although crude fiber does not completely represent chitin, it is assumed that chitin is mixed with some of the substances that make up crude fiber. In this study, wavelengths ranging from 2,100 to 2,350 nm were helpful in predicting the crude fiber content.
The model accuracy of the crude ash sample had an R2P range of 0.94–0.96, and an RMSEP range of 0.25%–0.32%. Among them, the preprocessing method using the mean normalization technique showed the highest accuracy for R2P at 0.96 and the lowest RMSEP at 0.25% (Table 2). The main beta coefficient wavelengths of the ash samples were found in the 1,224, 1,353, 1,400, 1,735, and 1,923 nm regions, and their shapes were similar to those of the beta coefficients of crude protein (Fig. 6). In theory, energy is not absorbed by inorganic substances such as ash in the NIR region. Therefore, the ash content cannot be directly determined by NIR (He et al., 2023). However, many wavelengths in the NIR region used in the calibration development process are expected to be predicted by correlation with the total amount of organic compounds and moisture because they provide important information (Pojić et al., 2010).
Unlike spectrometers, hyperspectral images contain wavelength information for each pixel, making it possible to visualize information that is difficult to see with the naked eye. Therefore, in this study, chemical images were created for each component, including moisture, crude protein, crude fat, crude fiber, and crude ash content, and visualized according to their respective concentrations (Fig. 7). Red pixels represent high concentrations and dark blue pixels indicate low concentrations. As the drying time and temperature increased, the moisture content decreased gradually, which was monitored by observing an increasing number of blue pixels. For crude protein, crude fat, crude fiber, and crude ash, the number of red pixels increased with the drying time and temperature. It is confirmed that the proposed prediction model performs well.
Conclusion
In this study, we developed a proximate component prediction algorithm based on SWIR HSI in the 1,000–2,350 nm range for dried raw materials, according to the drying time and drying temperature of BSFL. A model was developed for moisture, crude protein, crude fat, crude fiber, and crude ash contents. Through this study, it is anticipated that it will be possible to classify defective factors and incompletely dried individuals in the dried raw materials of BSFL. The results of this study are deemed suitable for detecting the nutritional components in BSFL and for use in the manufacturing of mixed feed by feed companies. We anticipate that this will enable quality control of dried raw materials from BSFL. However, further development of a rapid detection technology for BSFL is necessary for real-time sorting machine production, and additional research is required for this purpose. In particular, for BSFL, it is necessary to classify them based not only on the feed source but also on the individuals raised using food waste and the larvae used for composting livestock manure, as their nutritional components can vary depending on the feed source. In Korea, BSFL raised using livestock manure cannot be used as feed; therefore, it is necessary to develop a classification technology for such larvae. We hope that the results of this study can be utilized as a basis for the development of sorting machines for BSFL.


