Introduction
Milk is one of the major food resources containing various essential nutrients (Haug et al., 2007). In particular, milk protein, mainly consisting of casein (80%) and whey protein (20%), usually accounts for approximately 3% of whole milk (Pereira, 2014). Milk protein has showed higher digestibility than plant source protein (Gilani and Sepehr, 2003; Mathai et al., 2017). Moreover, both caseins and whey proteins are important sources of branched-chain amino acids and other bioactive peptides (Bos et al., 2000; Scholz-Ahrens and Schrezenmeir, 2000).
The amino acid sequence of milk proteins primarily influences the digestibility and physicochemical characteristics of milk proteins and also leads to different digestion kinetics (Gan et al., 2018). Caseins are easily coagulated by pepsin under a gastric condition so that it is slowly digested whereas whey proteins rapidly pass through the stomach, are digested to amino acids and peptides in the intestine, and increase the amino acid level in blood (Boirie et al., 1997; Hall et al., 2003; Mahé et al., 1996; Ye et al., 2016).
Because of the difference between casein and whey protein characteristics, the casein to whey protein ratio in milk formulation has affected in vitro digestion and physiological activities in many aspects. A casein to whey protein (CW) ratio of 40:60 exhibited higher in vitro digestion compared to 60:40 and 80:20 in infant formula (Phosanam et al., 2021). Similarly, as the casein portion increased in milk protein from 20% to 100%, solid curd was easily formed in simulated gastric conditions (Mulet-Cabero et al., 2020). Recently, Wood et al. (2021) reported that modification of goat milk-based protein formulation from 80:20 to 40:60 influenced food intake and hypothalamic neuronal activation in mice. In addition, modification of the casein:whey protein (CW) ratio to 40:60 reduced the allergenic potential compared to natural cow’s milk (Lara-Villoslada et al., 2005). Taken together, it could be suggested that modification of milk protein type may have different nutritional outcomes.
Although compelling evidence regarding the protein quality of each milk protein and the effects of the casein to whey protein ratio on in vitro digestion and physiological activities has existed, the effects of various blending ratios of casein to whey protein on physicochemical properties and in vivo protein quality have not yet been fully elucidated. Based on the above mentioned studies, we hypothesize that modified casein to whey protein ratios may play an important role in protein quality including utilization and digestibility in rats.
Materials and Methods
Micellar casein isolate (MCI; Refit Micellar Casein isolate 88; Protein: 85%) and whey protein isolate (WPI; HilmarTM 902; Protein: 89.5%) were obtained from Friesland Campina ingredients (Wageningen, The Netherlands) and Hilmar ingredients (Hilmar, CA, USA), respectively.
Milk protein dispersions (5% protein, w/w) with different CW ratios (CW-10:0, CW-8:2, CW-5:5, and CW-2:8) were prepared by reconstitution of appropriate amounts of MCI and WPI. The protein dispersions (2 L) went through a two-stage homogenizer (Ariete NS 2006, GEA, Italia) at 110 bar and 50 bar, respectively. The aliquots of samples (1 L) were heated in a 95°C water bath (Chang Shin Science, Seoul, Korea) for 30 min to simulate pasteurization.
The samples were placed on a multi-stirrer (MS-MP8, Wisd Laboratory Instruments, Wertheim, Germany) for 1 h at 350 rpm and were subjected to centrifuge (Beckman Coulter, Fullerton, CA, USA) at 6,000×g for 20 min. The protein solubility of the samples (unheated and heated samples) were calculated by quantifying proteins before and after centrifugation. The protein content of the samples was determined using the bicinchoninic acid assay (Cortés-Ríos et al., 2020). Briefly, sample (25 μL) was mixed with bicinchoninic acid (BCA) solution (200 μL) in a 96-well plate and placed in a plate reader (Biotek Instruments, Winooski, VT, USA) for 30 min at 37°C. The absorbance was taken at 562 nm and protein content was calculated from the standard curve prepared using bovine serum albumin (BSA).
The changes in the particle size distribution of milk protein dispersions before and after pasteurization were measured using a particle size analyzer (LA-960 Laser Scattering Particle Size Analyzer, Horiba, Osaka, Japan) as previously described (Yun and Imm, 2021).
The protein profile of CW-2:8 dispersion was analyzed since only CW-2:8 dispersion showed significant changes in particle size distribution upon heat treatment. The freeze-dried samples (CW-2:8 and heated CW-2:8; 20 mg/mL) were loaded onto a column (15 mm×450 mm) packed with Sephacryl S-500HR (GE Healthcare Bioscience, Uppsala, Sweden). The sample was eluted with Bis-Tris-Propane buffer (20 mM, pH 7.0) at a flow rate of 1 mL/min. The eluted peak fraction detected at 215 nm was collected using multiple preparative liquid chromatography system (LC-Forte/R, YMC, Kyoto, Japan).
The protein profile in the collected peak fraction was analyzed by sodium dodecyl sulfate-polyacrylamide gel electrophoresis (SDS-PAGE). The proteins in the samples were separated on a 4%–20% acrylamide gradient gel (Biorad Laboratories, Richmond, CA, USA) using a Biorad mini gel electrophoresis unit and a ChemiDac XRS+system (Biorad Laboratories) was used for the visualization of the bands.
Male Sprague-Dawley rats (4 wk-old) were obtained from Koatech (Pyongtaek, Korea). Animals were housed at a temperature of 23°C and relative humidity of 50±10%, and maintained under a 12-hour light-dark cycle, with feed and water available ad libitum. After a week of acclimation, the rats were randomly divided into five groups (n=8 for each group): CW-10:0, CW-8:2, CW-5:5, CW-2:8, and nitrogen-free (N-free). The composition of experimental diets is shown in Table 1. Diets based on AIN-93M (Saeronbio, Uiwang, Korea) were formulated to contain 10% protein according to the official PER AOAC 960.48 method. After four weeks, the rats were fasted overnight and anesthetized with 10 mg/kg xylazine (Bayer Korea, Seoul, Korea) and 100 mg/kg ketamine (Yuhan, Seoul, Korea). The animal experiment was conducted under the guidance of the Hanyang University Animal Care and Use Committee (HY-IACUC-19-0159).
Body weight and feed intake were measured once a week throughout the experiment. Body weight gain was calculated using body weight recorded at the beginning and the end of the experiment. The feed efficiency ratio was calculated using Eq. (1).
To evaluate the protein utilization, the protein efficiency ratio (PER) and net protein ratio (NPR) were assessed according to the official procedures recommended by the AOAC Official Method 960.48 and calculated using Eq. (2, 3). The weight loss of the N-free group was used to determine NPR. To evaluate the protein digestibility, the rats were housed individually in metabolic cages to collect separate feces for three days at the second week. The collected fecal samples were dried and ground before total nitrogen analysis. The total nitrogen of the fecal samples was analyzed by the Kjeldahl method (AOAC). True digestibility (TD) was calculated using Eq. (4). The result of the fecal sample from the N-free group was used to confirm endogenous nitrogen.
Results and Discussion
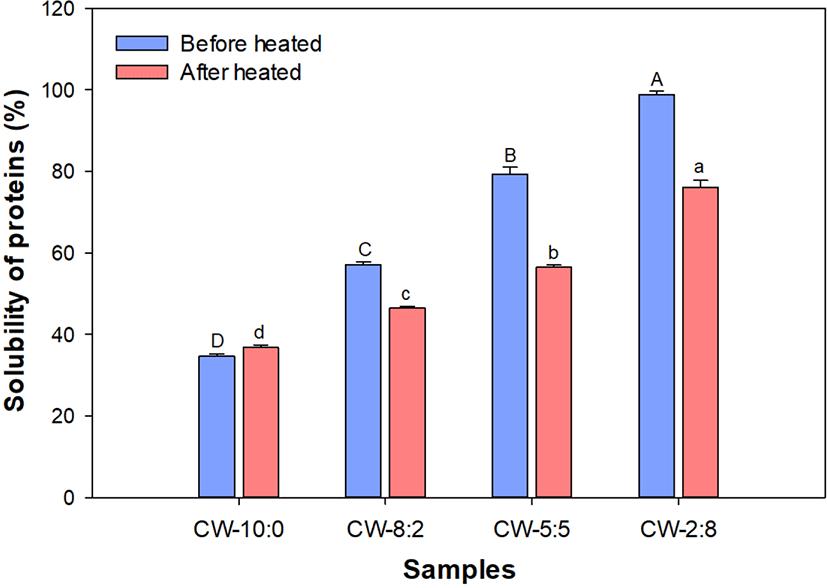
High protein beverages are gaining popularity in the market and dairy proteins are one of the attractive options for the production of high protein beverages. However, the decrease in protein solubility by heat-mediated protein-protein interactions is a major factor to limit product stability. The solubility of protein dispersions (5% protein, w/w) was measured by quantifying proteins before and after centrifugation. Protein solubility increased as the proportion of whey proteins increased in the dispersion (Fig. 1).

MCI is a high protein dairy ingredient manufactured by microfiltration. Since casein micelles in MCI are close to the native state, MCI has been suggested as an alternative for traditional casein isolate prepared using acid or rennet (Carter et al., 2021). Low reconstitution and solubility of MCI were reported and were found to be due to the slow dissolution rate of casein micelles from the powder surface (Schokker et al., 2011; Zhang et al., 2018). The lower storage temperature delayed loss of the rehydration property by preventing surface hardening from the casein micelle surface (Burgain et al., 2016).
Heat treatment (95°C, 30 min) lowered solubility except for CW-10:0. The gap in solubility before and after heating also increased with increasing whey proteins in CW-8:2 and CW-5:5 but no further increase was observed in CW-2:8. This result suggests that MCI is quite heat stable at the tested pH (pH 6.7) and concentration (5%, w/w). However, Sauer and Moraru (2012) reported that high temperature treatment such as ultra high temperature (UHT) and retort heating caused instability of the MCI dispersions (10%, w/w). The pH-induced alteration of mineral balance and casein dissociation from the casein micelle surface was responsible for the heat instability of MCI.
Heat-induced decreased solubility is probably associated with the formation of high molecular weight protein aggregates. Liyanaarachchi et al. (2015) demonstrated that the average particle size of heat-induced whey protein aggregates can be decreased by increasing the proportion of casein in the protein dispersion (10% total solid). Caseins exerted chaperone-like activity in heat-induced whey protein aggregation and cause aggregated whey protein to be soluble.
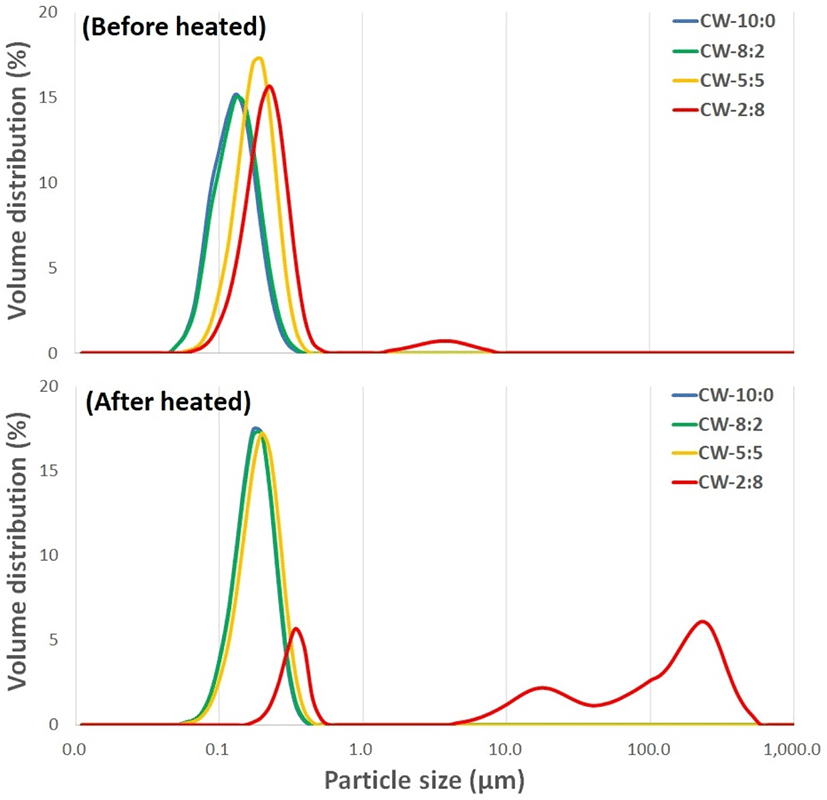
Particle size distribution of protein dispersions varied depending on the CW ratios. Before heating, most particles in CW-10:0, CW-8:2, and CW-5:5 were present in the submicron range while a small volume of larger particles of 2–6 μm was noted in CW-2:8 dispersion (Fig. 2). Substantial changes in particle size distribution by heating were found only in CW-2:8 and displayed three broad peaks. This suggests particles with different levels of whey protein aggregation are produced when sufficient whey proteins are present in the dispersion.

Singh et al. (2019) reported that UHT processed CW-8:2 and CW-5:5 displayed similar particle size distribution at the sub-micron range, but particle size distribution was significantly increased when the proportions of whey proteins in the mixtures were greater than 50% (CW-4:6, D (0.9)=110 μm). They concluded that casein acted as a chaperon to inhibit the formation of whey protein-mediated large protein aggregates. Our result was also consistent with a previous report by Beaulieu et al. (1999) that heating (95°C, 5 min) of model milk protein dispersion produced protein aggregates of various sizes, and the occurrence of heterogeneous aggregates increased from CW-80:20 to 20:80. The formation of large aggregates probably increases the risk of deposit accumulation on the heat exchanger (Khaldi et al., 2015).
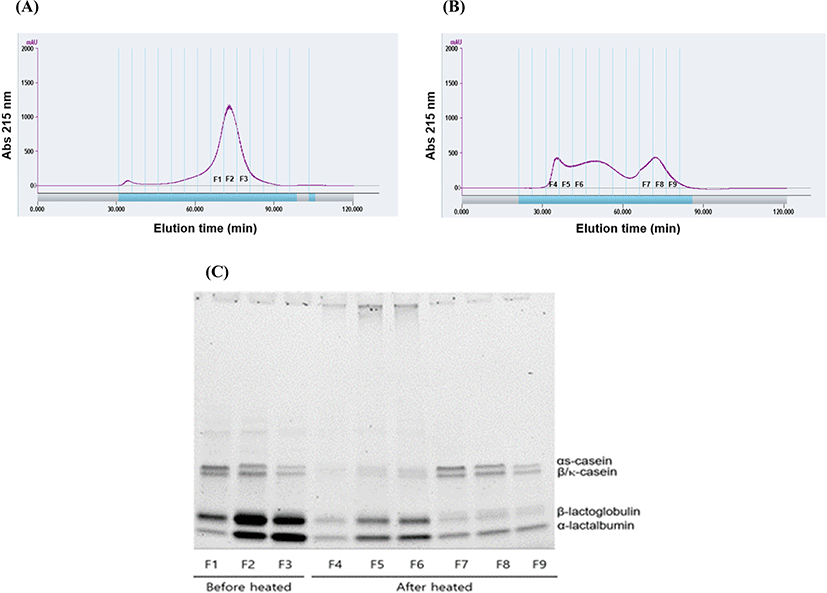
Various sizes of large protein aggregates were formed by the heating of CW-2:8 dispersion. To analyze the involvement of individual proteins for aggregate formation, unheated and heated CW-2:8 dispersion were separated using size exclusion chromatography. The protein profile of the peak fractions was analyzed by SDS-PAGE.
Before heating, CW-2:8 eluted as one peak, and the intensity of the casein bands decreased as elution time passed (Fig. 3A and 3C). This indicated that whey proteins were present mainly as unaggregated forms. The peak fraction of CW-2:8 decreased by heating and eluted in broad elution time from 30 to 80 min (Fig. 3B). Interestingly, early peak fractions (F3, F4, and F5) consisted of whey proteins whereas later peak fractions (F7, F8, and F9) contained both caseins and whey proteins. This result suggests that self-aggregation of whey proteins is the major contributor to the formation of large molecular weight aggregates compared to the contribution of casein micelle and whey proteins where the interactions are relatively small. Havea et al. (2001) characterized heat-induced whey protein aggregates. They found that homo- and heteropolymers of β-lactoglobulin (β-LG), α-lactalbumin (α-LA), and BSA were produced via disulfide bonds during the heating of whey protein concentrate. This report suggested that whey protein aggregates with diverse sizes can be formed by self-aggregation of whey proteins.

Gaspard et al. (2017) reported that the stability of heat-induced milk protein aggregates increased as the proportion of casein increased in the aggregates. The presence of κ-casein or sodium caseinate protected the whey protein from heat-induced aggregation, and these effects were closely related to decreased hydrophobic interaction (Guyomarc’h et al., 2009). Kehoe and Foegeding (2011) reported that β-casein acts as a chaperone and controls the size of whey protein self-aggregation upon heating. Competition occurred between β-casein and whey proteins during the aggregation process.
Based on the above results, an increase of whey proteins up to CW-2:8 may cause protein instability, especially in long shelf-life UHT-sterilized protein beverages. However, there was no sign of protein stability problems by heating in CW-10:0, CW-8:2, and CW-5:5.
The effects of CW ratio on body weight, body weight gain, feed intake, and feed efficiency ratio were examined. As shown in Table 2, no significant difference was observed in body weight and body weight gain in all experimental groups. In addition, feed intake was unchanged among the samples containing both casein and whey protein. Only the sole casein fed group showed greater feed intake compared to the other groups. However, the groups that had the higher proportion of whey proteins (CW-5:5 and CW-2:8) showed higher feed efficiency ratios than the other groups.
This observation was consistent with a previous study that body weight gain in rats reared with modified CW ratios (CW-2:8, CW-4:6, CW-6:4, and CW-8:2) did not show a significant difference (Yajima et al., 1998). However, Eller and Reimer (2010) demonstrated that complete dairy proteins consisting of casein and whey reduced weight gain in high-fat and high-sucrose diet-fed rats compared to casein or whey protein alone. Administration of whey protein showed reduced weight gain compared to a casein control in high-fat fed mice, and this weight gain reduction was associated with changes in gut microbiota (Tranberg et al., 2013). The difference in diet composition (normal vs. high fat) and duration of feeding trial (8 or 14 vs. 4 wks) may be responsible for the discrepancy in the results between the present study and previous reports (Eller and Reimer, 2010). Taken together, diets with modified casein to whey protein ratios did not alter body weight and weight gain; however, diets with greater than or equal to 50% of whey protein showed a lower feed intake and higher feed efficiency ratio.
The PER, representing the contribution of protein diet in rat growth, has been widely used as a standard method for protein quality assessment. A more precise method than PER has been the NPR by considering weight loss of rats from the non-protein diet in weight gain of rats (Gilani, 2012). The amino acid composition and digestibility also affect the nutritional quality of proteins. Thus, the effects of modified casein: whey protein ratios on PER, NPR, and TD were compared. As shown in Table 3, the PER and NPR were higher for the CW-5:5 and CW-2:8 than for CW-10:0 and CW-8:2. No significant difference was found in nitrogen intake among the groups. Fecal nitrogen was lowered as the portion of whey protein in the diet was increased. Although TD was close to 100% in all groups, CW-2:8 showed significantly higher TD than other samples (p<0.05). Thus, CW-5:5 and CW-2:8 had greater effects on protein utilization than other formulations.
It has been reported that whey protein had significantly higher PER, NPR, and TD compared to casein and CW-7:3 (Haraguchi et al., 2010). Unlike the results of our study, CW-7:3 did not show higher PER and NPR than casein. However, they compared only three different diet groups and the effect of different CW ratios on protein digestibility was not further investigated. It is assumed that the portion (30%) of whey protein in the diet was not sufficient to make a difference over the casein group. In accordance with our study, CW-6:4 showed higher PER than the casein group in growing rats (Van Dael et al., 2005). This may be due to greater sulfur-containing amino acid content in whey proteins since amino acids such as cysteine and methionine had greater effects in the improvement of PER (Walzem et al., 2002; Potter and Kies, 1990).
Phosanam et al. (2021) examined the influence of CW ratio (40:60, 60:40, and 80:20) using an in vitro digestion model. The samples with high casein ratios lowered digestibility by extensive gastric coagulation. Huppertz and Chia (2021) reported that gastric coagulation critically influences further digestion by regulating gastric emptying. The formation of casein clots and slower gastric emptying delay the digestion rate of caseins but casein ingestion resulted in a prolonged postprandial increase in plasma amino acids compared with rapidly digested whey proteins with a short plasma amino acid increase (Boirie et al., 1997). Gorissen et al. (2020) demonstrated that greater radio-labeled phenylalanine (Phe) was in systematic circulation when a mixture of casein and whey protein was administered compared with whey protein or casein alone in a human clinical trial. This result suggests that type of protein critically influences protein digestion and the kinetics of amino acid absorption. They also observed that postprandial Phe rise varied depending on protein dosage and age.
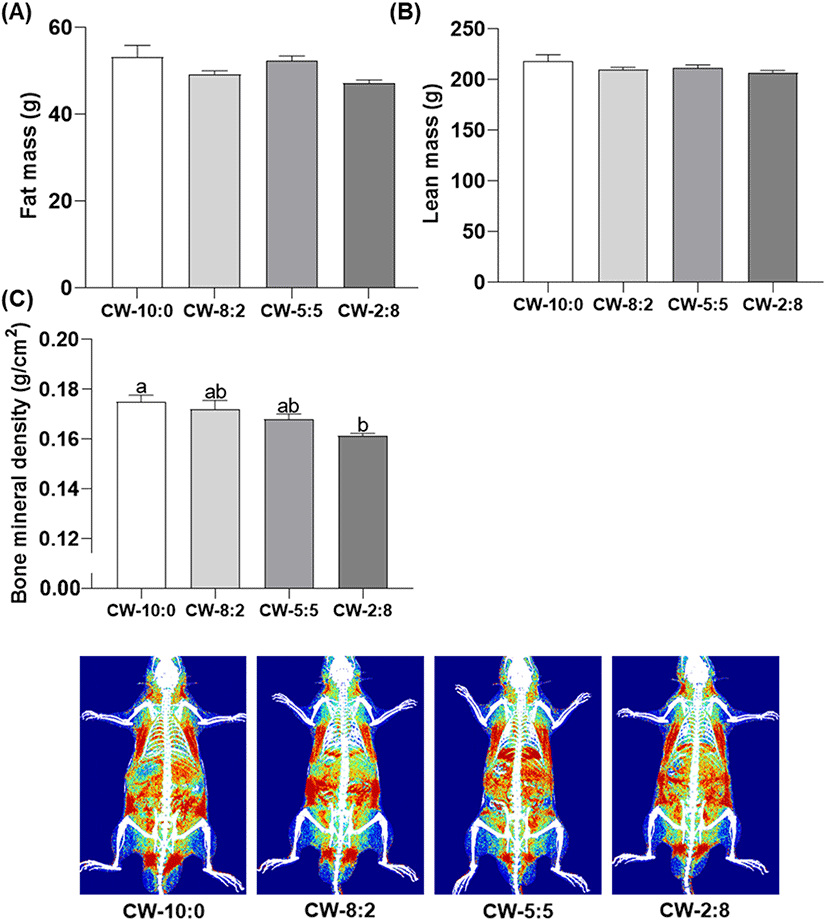
Changes in the body composition of the rats fed experimental diets for 4 weeks are shown in Fig. 4. Both total fat and lean mass analyzed by DEXA did not show significant differences in all treatment groups. It is consistent with a previous report that casein and whey protein diet did not change fat mass (Wróblewska et al., 2018). However, according to the results of previous studies, branch chain amino acids (BCAA) especially leucine (Leu) (11% whey vs. 8% casein, w/w), play a key role in muscle protein synthesis (Boirie et al., 1997; Layman, 2003). Whey proteins are considered as better protein sources than caseins for increased muscle mass but their rapid disappearance in plasma possibly limits utilization of BCAA. In accordance with this speculation, too rapid digestion of whey proteins (milk soluble protein isolate) could not meet the postprandial anabolic requirement (Lacroix et al., 2006).

Thus, modulation of the optimum CW ratio for better utilization of BCAA provides beneficial effects for increased muscle synthesis. Van Dael et al. (2005) reported that higher PER and improved protein utilization were obtained when the diet composition with CW-40:60 was compared with the sole casein diet in growing rats. Although the exact reasons for no difference in muscle mass in the present study are uncertain, decreased feed intake in CW-5:5 and CW-2:8 may have counteracted the improved protein utilization in the CW-5:5 and CW-2:8 diet group.
Zhang et al. (2007) reported that dietary Leu supplementation effectively improved high fat diet-induced obesity and glucose metabolism whereas increased Leu intake did not show notable effects in normal diet-fed mice. In another study, Leu-fortified whey protein promoted muscle protein synthesis but administration of Leu alone did not show a positive effect on muscle synthesis in aged mice (Dijk et al., 2018). These results suggest important findings for product application. The effect of dietary protein-induced muscle protein synthesis varied depending on the age and nutritional status of the target groups, and therefore modulation of CW formulation might have more positive effects on obese and elderly populations than healthy people.
BMD decreased as the proportion of whey proteins increased in the diet. A significant difference was found between the CW-10:0 and CW-2:8 groups (p<0.05). However, there was no significant difference among the other groups (Fig. 4C). Based on the product information, the calcium content of MCI and WPI is 1,900 mg/100 g and 46 mg/100 g, respectively. The difference in total calcium content in the protein source probably affects calcium availability. In terms of the qualitative aspect, the type of mineral (organic vs. inorganic) is also important for the absorption and retention efficiency for animals (Liu et al., 2014). Micellar casein contains calcium in the form of colloidal calcium phosphate (organic form) which facilitates better absorption than the inorganic form. The same effect was demonstrated in calcium-fortified milk using mice (Singh et al., 2007). Our findings are consistent with previous results that the casein fed group showed higher total and trabecular BMD compared to the whey protein fed group in piglets (Budek et al., 2007). McKinnon et al. (2010) reported that diets containing goat milk casein (80% and 57%) resulted in increased calcium absorption in growing rats compared to the casein-free diet containing equal protein and calcium content. In summary, there was no significant difference in BMD among CW-10:0, CW-8:2, and CW-5:5 in growing rats while calcium fortification might be beneficial for CW-2:8 for adequate bone growth and development.
Conclusion
Modification of the casein to whey protein ratio affected the extent of protein aggregation and heated CW-2:8 showed significantly increased larger particle (>100 μm) size distribution. The largest protein aggregates were formed by whey protein self-aggregation. There was no significant difference in protein aggregation when the CW ratios changed from 10:0 to 5:5. In terms of protein quality, protein utilization and digestibility showed an increasing trend as the proportion of whey proteins increased in the diet. There was no significant difference in BMD between native cow’s milk (CW-8:2) and CW-5:5 but CW-2:8 resulted in significantly lower BMD. Future detailed studies will be required to investigate the effects of modified casein and whey protein formulations on metabolic health and disease prevention.


