Introduction
Meat and its derivatives play a crucial role as a significant protein source and are indispensable components of the human diet (Li et al., 2022). However, sometimes they have been adulterated deliberately or accidentally with more than one species or undeclared admixture (Ruiz Orduna et al., 2017). Adulterating beef with pork is a common fraudulent practice driven by economic motives, as pork is generally cheaper than beef (Mannaa, 2020; Yang et al., 2018). While this adulteration may not pose significant health risks, it can result in economic losses and potentially endanger consumers with allergies to particular food items (Ghovvati et al., 2009; Nurjuliana et al., 2011). Moreover, it has some ethical and religious issues, as pork is strictly prohibited to Muslims (Nakyinsige et al., 2012). Hence, it is necessary to authenticate meat species and detect this type of adulteration.
To mitigate the risk of adulteration, clear guidelines for authenticating meat must be established by regulatory bodies with governing authority (Ruiz Orduna et al., 2017). Furthermore, there is a need for sensitive and selective methodologies to identify and detect such forms of adulteration. Numerous techniques employed previously have demonstrated high effectiveness in detecting minute levels of adulteration (Pavlidis et al., 2019). These techniques include immunological and enzymatic techniques, DNA-based assay, various spectrometry and chromatography-based methods, NMR-based techniques, and electronic nose (Jakes et al., 2015; Lo and Shaw, 2018; Mandli et al., 2018; Nurjuliana et al., 2011; Pranata et al., 2021). Nevertheless, nowadays, detecting meat adulteration in cooked meat using headspace solid-phase microextraction-gas chromatography-mass spectrometry (HS-SPME-GC-MS) has gained popularity based on the volatile compounds as they are formed after cooking and gives specific flavour characteristics of meat (Amalia et al., 2022; Pranata et al., 2021). The volatile compounds are generated during cooking via an intricate sequence of chemical reactions, encompassing the Maillard reaction, lipid degradation, Strecker degradation, and interactions between intermediate reaction products and degradation byproducts (Aaslyng and Meinert, 2017). Volatilomics is regarded as a promising tool that can be utilized for detecting food fraud, evaluating quality, and verifying authenticity.
GC-MS is highly efficient in identifying unknown compounds present in any given sample. Different techniques are used for extracting volatile compounds including dynamic headspace extraction on Tenax TA, simultaneous steam distillation-solvent extraction, solvent-assisted flavor evaporation, and HS-SPME (Madruga et al., 2009). In this study, HS-SPME was selected due to its well-documented efficacy in extracting volatile compounds from meat. It offers notable advantages including simplicity, solvent-free operation, reusability, and swift extraction time, as supported by previous studies (Li et al., 2022; Pavlidis et al., 2019; Pranata et al., 2021). GC coupled with MS emerged as an apt method for the identification and quantification of volatile compounds within meat, as evidenced by the work of Amalia et al. (2022). SPME-GC-MS is frequently reported as a powerful technique to differentiate between meat species and detect meat adulteration with multivariate analysis or machine learning techniques (Dahimi et al., 2014; Pavlidis et al., 2019; Pranata et al., 2021).
The study’s objective reported here was to detect adulteration in cooked meat and detection of pork in mixed beef and pork meat. With the volatile compounds data obtained from GC-MS, a multivariate statistical model was developed for the authenticity of meat species and the identification of discriminating volatile compounds for each type of meat.
Materials and Methods
Ten Hanwoo cattle with a market weight ranging from 425 to 455 kilograms were randomly chosen from a slaughter plant located in Jinju-Si, Gyeongsangnam-do, Republic of Korea. The fresh beef round was dissected from each carcass 48 h postmortem. A total of 10 pigs (castrated boar; Landrace♂×Yorkshire?×Duroc♂, market weight 69–74 kg) were randomly selected at a slaughter plant. Fresh pork round was dissected each carcass 48 h postmortem. Upon arrival at the laboratory, all subcutaneous and intermuscular fat, along with any visible connective tissue, were promptly removed from the fresh muscles. The muscles were subsequently sliced into small segments and thoroughly pulverized to create a uniform paste using a grinder. A total of four different groups of samples were made, two of them were pure (only beef & only pork) and two were adulterated. The adulterated mixed samples were prepared in two different ratios (80% beef and 20% pork; 60% beef and 40% pork). Next, 100 grams were measured from each group for cooking purposes. The study utilized a total of 20 distinct animals, resulting in the analysis of 40 samples, with each sample having three replicates.
The ground meat samples were cooked by pan-roasting on an electric hot plate set to temperatures over 150°C for 5 minutes. Before cooking, the surface temperature of the hot plate was calibrated using a laser infrared thermometer (BO-350; Bluebird, China). The ground meat was consistently stirred and blended using a steel spatula throughout the cooking process. The temperature was consistently maintained between 150°C and 170°C, with continuous monitoring facilitated by a laser infrared thermometer (BO-350; Bluebird). Following the cooking process, the sample was allowed to cool to room temperature before being vacuum-sealed and stored in a freezer at –80°C until analysis.
The sample preparation followed a method with slight modification (Ahamed et al., 2023). Each cooked sample, precisely 2.5 grams, was combined with 5 mL of a 25% NaCl solution. This mixture underwent thorough homogenization for one minute using a homogenizer. Subsequently, the prepared samples were transferred into 20 mL glass vials (Supelco, Bellefonte, PA, USA). An internal standard of 1 μL of 0.4 mg/mL 2-methyl-3-heptanone dissolved in hexane was added. The vials were tightly sealed using mininert valves. For extraction of volatile compounds, the DVB/CAR/PDMS- 50/30 μm (PAL Smart SPME Fiber) fiber was utilized. The vial containing the sample was initially heated for 15 minutes at 60°C as an incubation period. Following this, the SPME fiber was exposed to the headspace of the vial for an additional 30 minutes under the same temperature conditions with continuous shaking. Upon completion of the absorption process, the SPME fiber was desorbed in the injection port of the GC-MS instrument for 6 minutes. Prior to usage, the fiber was conditioned at 270°C for 30 minutes. Additionally, before each analysis, the fiber underwent exposure to the injection port of the GC for another 10 minutes to clean it.
GC-MS analyses were performed utilizing an Agilent 7890B gas chromatograph coupled with an Agilent 5973C quadrupole mass spectrometer (Agilent Technologies, Santa Clara, CA, USA). An autosampler (PAL, Agilent Technologies) was also employed in the analysis process. Helium (99.99%) was employed as the carrier gas, maintaining a steady flow at a rate of 1 mL/min. The injection port was fitted with a liner (0.75 mm i.d, Agilent Technologies) specifically designed for SPME analysis, and maintained at a temperature of 250°C. An HP-INNOWax capillary column (60 m×0.32 mm, 0.25 μm film thickness, Agilent Technologies) was utilized for compound separation. Initially, the oven temperature was set at 40°C and held for 3 minutes. Subsequently, there was a gradual temperature increase at a rate of 4°C/min up to 120°C, followed by another increase at a rate of 8°C/min up to 220°C. A rapid increase to 250°C was then applied at a rate of 20°C/min and maintained for 5 minutes. The interface temperature was set to 280°C. The mass spectrometer operated in electron ionization mode, with the electron energy set to 70 electron volts (eV) and a scanning range spanning 50 to 450 mass-to-charge ratio (m/z). The ion source and quadrupole temperatures were established at 230°C and 150°C, respectively. During injection, a pulsed splitless mode was employed throughout the experiment.
All volatile compounds were identified by comparing their mass spectra with the built-in NIST v.14 mass spectral library (NIST/EPA/NIH Mass Spectral Library with Search Program), with a minimum mass match quality of 80% considered for each compound. Additionally, compounds were verified using the linear retention index (LRI) from the PubChem library and NIST Chemistry Webbook. To ensure the reliability of retention times and tentative identifications, authentic samples of several detected compounds were analyzed. The LRI was determined using a homologous series of even-numbered n-alkanes ranging from C6 to C40 (Polyscience, Niles, IL, USA), under identical chromatographic conditions as those applied to the samples. The calculation of LRI was performed using an equation described in a prior study (Pranata et al., 2021).
Before further processing, a data pre-treatment step was performed to convert raw data into a cleaner format. This process involved employing Chemostation software to automate tasks such as peak alignment, annotation, and integration of the target ion peak area.
The relative concentration of each compound was assessed by calculating the peak areas. The concentration was computed following the method outlined in Ahamed et al. (2023), with slight adjustments, employing the subsequent formula and denoted as micrograms per kilogram (μg/kg).
All data analyses were carried out using SAS 9.4 software (SAS Institute, Cary, NC, USA). For multivariate data analysis, Metaboanalyst 5.0 (www.metaboanalyst.ca), was utilized. The data was first converted into a CSV file, followed by log transformation and Pareto-scaling for normalization. Peaks with more than 50% missing values were excluded from the analysis. Principal component analysis (PCA) and partial least squares-discriminant analysis (PLS-DA) models were employed as unsupervised and supervised methods, respectively, to distinguish between meat types based on the relative concentration of each compound. Additionally, a Random Forest test was conducted to identify the model’s most significant compounds and assess its predictive capability. Cross-validation and response permutation tests were utilized to evaluate and validate the models. Data was presented as mean±SE, and statistical significance was determined at p<0.05 using Duncan’s multiple range test.
Results and Discussion
Forty-five volatile compounds were identified from the meat samples, and they were categorized into different chemical groups, namely aldehydes (16), alcohols (8), pyrazines (6), acids (5), hydrocarbons (8) and miscellaneous (2), of which aldehydes were the most abundant in all samples. All of these volatile flavour compounds formed from the precursor of meat, namely, free amino acids, peptides, free sugars, vitamins, sugar phosphate, and low molecular weight water-soluble compounds (Koutsidis et al., 2008). Previous studies on cooked meat volatiles found a similar result that aldehydes and alcohols were the most abundant compounds (Beldarrain et al., 2022; Wei et al., 2022). Six to ten carbon-containing aldehydes were the most common and present in higher quantities (Moran et al., 2022). Table 1 shows the qualitative and quantitative analysis results of the volatile compounds. The aldehydes, alcohols, and some acids are the most abundant flavour families in cooked meat (Shi et al., 2019; Vilar et al., 2022). Many of the volatile compounds identified have been previously discussed in a review by Sohail et al. (2022) or validated in recent studies conducted by Amalia et al. (2022) and Pranata et al. (2021). The majority of these compounds are derived from processes such as the Maillard reaction, lipid degradation, and the interaction between compounds produced during these reactions, all of which occur during cooking (Pranata et al., 2021). Alcohols, primarily originating from lipid degradation, such as 1-octen-3-ol, 2-ethyl-1-hexanol, and 1-octanol, are prominent among the compounds identified in cooked beef and pork (Bueno et al., 2019).
This 1-octen-3-ol was found as a key compound responsible for pork flavour and found at a very high concentration in previous studies (Pavlidis et al., 2019; Pranata et al., 2021; Wu et al., 2022). In our study, among all the alcohols found in pork, 1-octen-3-ol was present at a higher concentration. Other alcohols include 1-heptanol, 2-octen-1-ol (E), 1-dodecanol, 2-phenyl-2-propanol, and 4-methyl phenol. Among these compounds, 2-phenyl-2-propanol was not found in previous studies. However, the possible reason for the occurrence of this compound is from the amino acid breakdown, particularly from phenylalanine, during meat cooking at high temperatures (Scognamiglio et al., 2012). Hexanal, octanal, and nonanal were the most common and elevated compounds found in all the samples (Beldarrain et al., 2022). The major aldehydes and alcohols were mainly derived from the auto-oxidation or degradation of unsaturated fatty acids, for instance, linolenic, linoleic, and oleic acids which are very abundant in beef and pork (Al-Dalali et al., 2022). The pyrazines are responsible for the roast flavour of the meat, and methyl group pyrazines are most common in cooked meat (Sohail et al., 2022). They are formed by the Maillard reaction. The 3-ethyl-2,5-dimethyl pyrazine is the most frequently occurring in cooked meat and strongly influences roast flavour (Sohail et al., 2022). This study identified five short-chain fatty acids: hexanoic acid, heptanoic acid, octanoic acid, nonanoic acid, and decanoic acid. This fatty acid strongly impacts the flavour and aroma of cooked meat and may come from the diet or microbial fermentation in the digestive system (Li et al., 2021a). These fatty acids were reported in a previous study (Zhao et al., 2017). Eight individual hydrocarbons were identified, which poorly contribute to the cooked meat flavour (Wu et al., 2022). Hydrocarbons are mainly derived from pasture-based diets and decarboxylation of higher fatty acids (Beldarrain et al., 2022). Among the hydrocarbons, 2-pentyl furan was a significant hydrocarbon and played an important role in overall pork flavour (Wang et al., 2016). The compound 1-formylpyrrolidine was not reported in any other previous research and may form from the reaction of lysine and arginine with reducing sugars like glucose and fructose during meat cooking (Li et al., 2023). Overall, the volatile compounds in cooked meat are mainly derived from amino acid and fatty acid metabolism. Many compounds were found to differ significantly in their abundance between beef and pork and some compounds did not have significant differences between beef and mixed group but were significantly different with pork. As in the mixed sample, the beef percentage was higher, which may be the possible reason for this. One study with raw meat also reaches a similar kind of conclusion (Pavlidis et al., 2019). In the PCA score plot, the mixed samples were clustered very close to the pure beef samples. For instance, some aldehydes like, heptanal, octanal, and nonanal do not have significant differences between the three meat groups other than pork. Some compounds were not found in more than fifty percent of the samples analyzed and were considered as not detected. Overall, mostly aldehydes, alcohols, and acids make the differences between the meat groups.
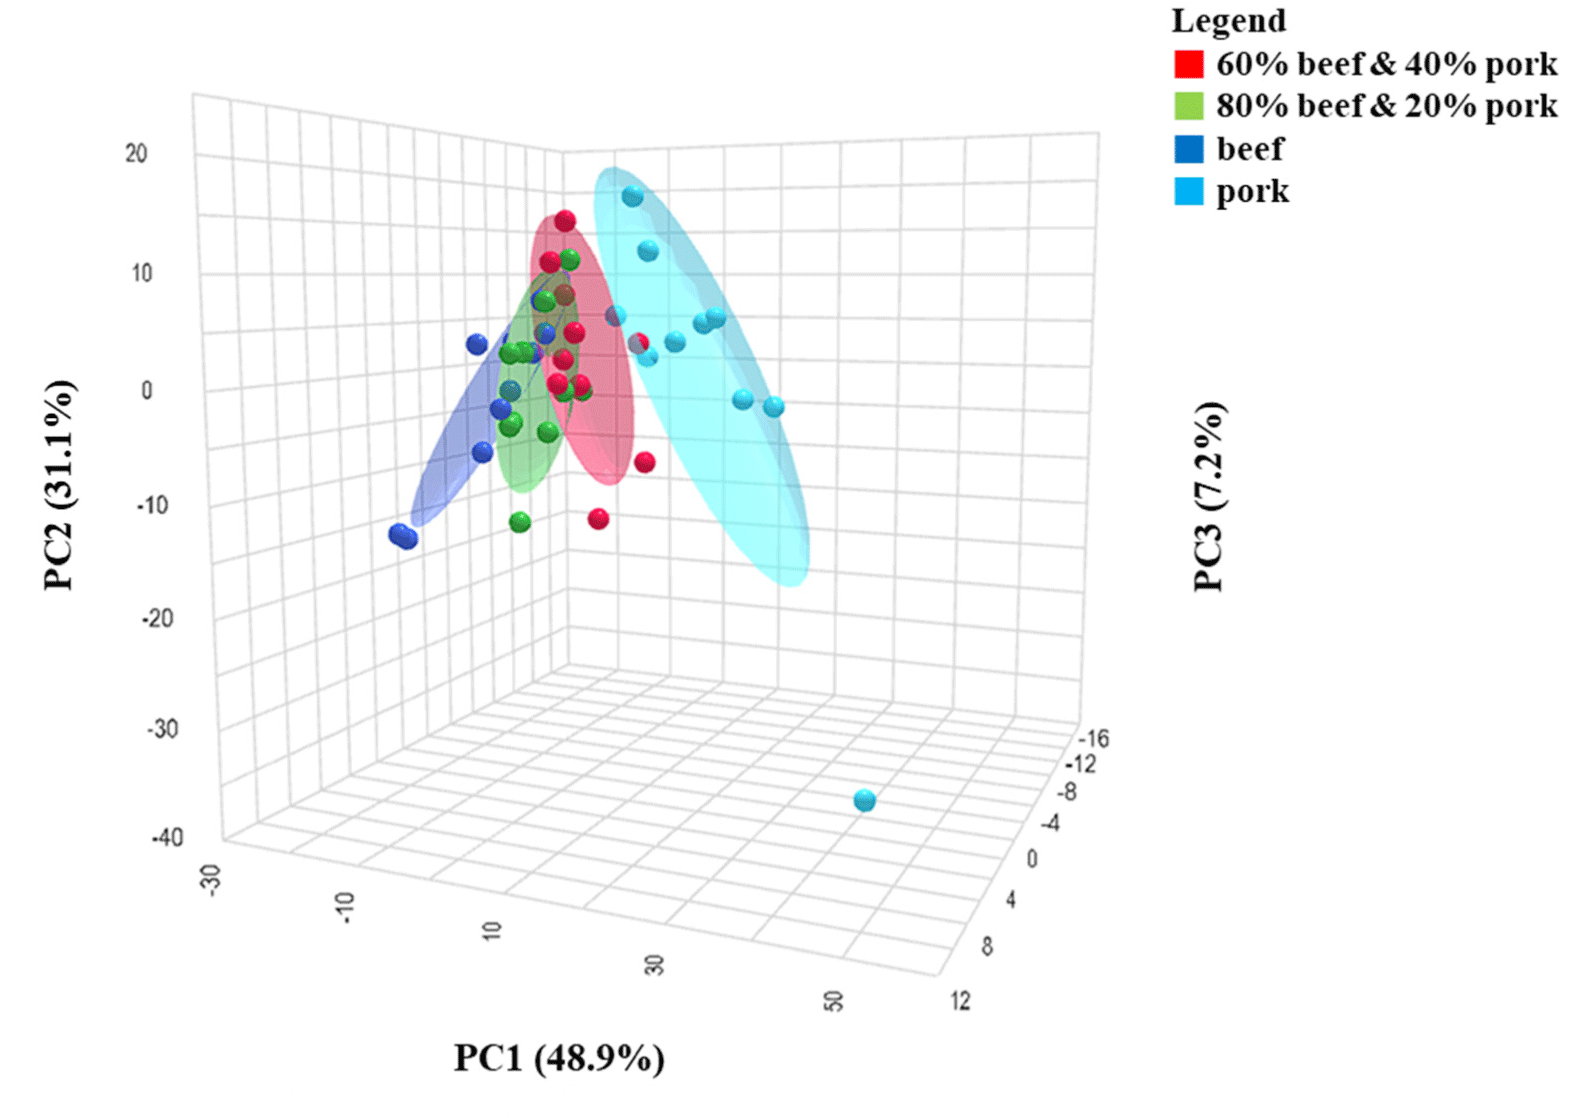
PCA was utilized as an unsupervised data analysis method to reduce the dimensionality of the data, visualize sample relationships, and identify differences and groupings among the samples based on the volatile compounds (Pavlidis et al., 2019). The first PC1 explains 48.9%, and the PC2 explains 31.1% of the variation of the data, with a cumulative contribution of 80%, and reflects most of the information on the overall characteristics of the samples. Fig. 1 shows the PCA score plot, and it is demonstrated that all four groups were clearly distinguished where beef and pork are situated in the two terminals, and the mixed samples lie between them. Moreover, the positions of the samples reflect the percentage of the adulteration. For instance, mixed samples of (60:40) were more closely clustered near the pork compared to (80:20). Even though there was a little overlap between the pure beef and two mixed samples, pure pork was completely clustered separately. The possible reason may be the higher percentage of beef in the mixed samples and almost similar volatile compounds in both types of meat, which differ only in their relative concentration (Bleicher et al., 2022; Vilar et al., 2022). As the PCA was run unsupervised, the scatter plots displaying sample outputs primarily depicted their relative positioning to one another. These positions can predominantly be influenced by experimental fluctuations, such as system noise and instrumental drift (Zhang et al., 2020). The PLS-DA model was implemented to overcome these issues and further construct a better model for discrimination.
PLS-DA is a versatile algorithm capable of both predictive and descriptive modeling, as well as characterizing differences between samples, serving as a valuable feature selector and classifier (Pranata et al., 2021). It facilitates linking metabolite information with different meat classes (Trivedi et al., 2016). Pure pork and beef samples were segregated on opposite sides of the PLS-DA score plot, with mixed samples positioned between them, leaning more towards the beef samples when the beef percentage was higher in the mixed sample. The PLS-DA score plot exhibited distinct clustering among pure beef, pork, and mixed samples, as depicted in Fig. 2.
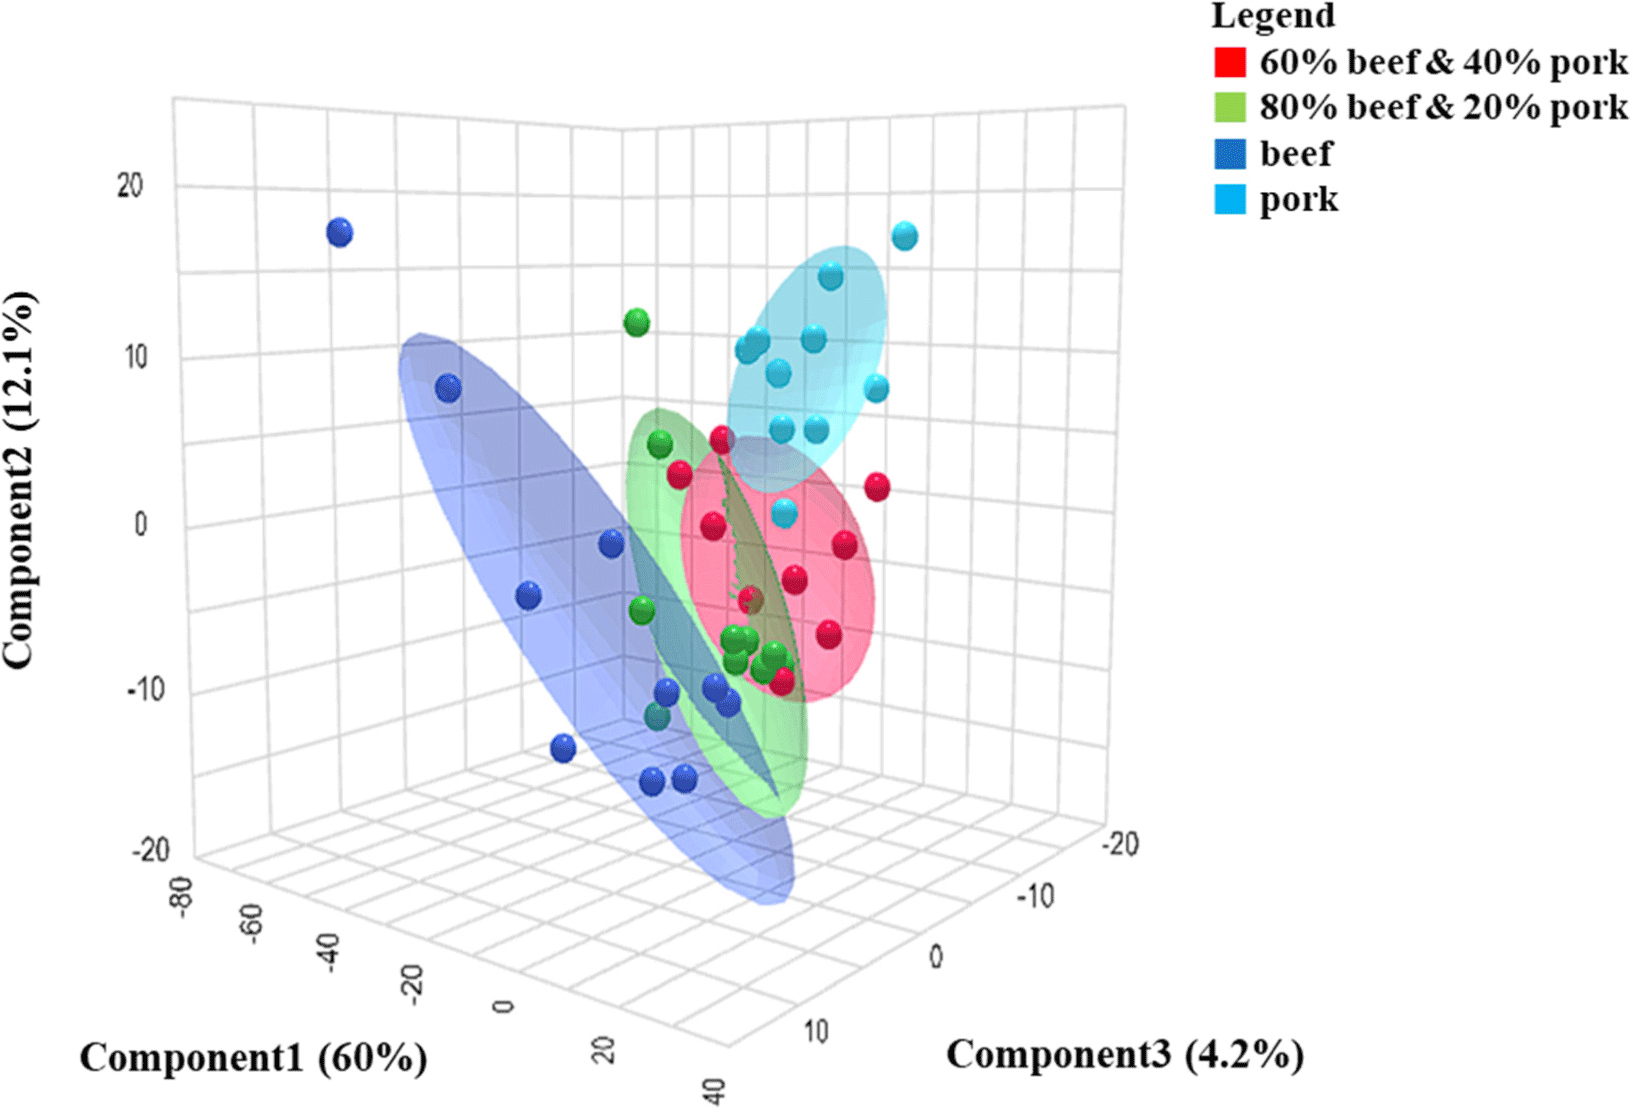
Model validation was done with 1,000 random permutations to identify the model’s prediction accuracy and to assess the reliability of the model, as sometimes the model can suffer from overfitting problems from the training dataset (Song et al., 2021). The p-value obtained from the permutation test was 0.001, which indicates the model’s validity (Amalia et al., 2022; Eriksson et al., 2008). Moreover, cross-validation was conducted to evaluate the reproducibility and predictive capability of the model. The r2 (model fitness) and Q2 (predictive performance) values were determined to be 0.78 and 0.80, respectively, indicating a well-fitted model. The first three PCs account for approximately 76.3% of the dataset’s variance, with the first component (PC1) explaining 60% of the dataset’s variance and providing optimal groupings. PLS-DA analysis not only distinguishes between known categories and predicts unfamiliar samples but also establishes a connection between metabolite data and each specific category (Cubero-Leon et al., 2014; Pavlidis et al., 2019).
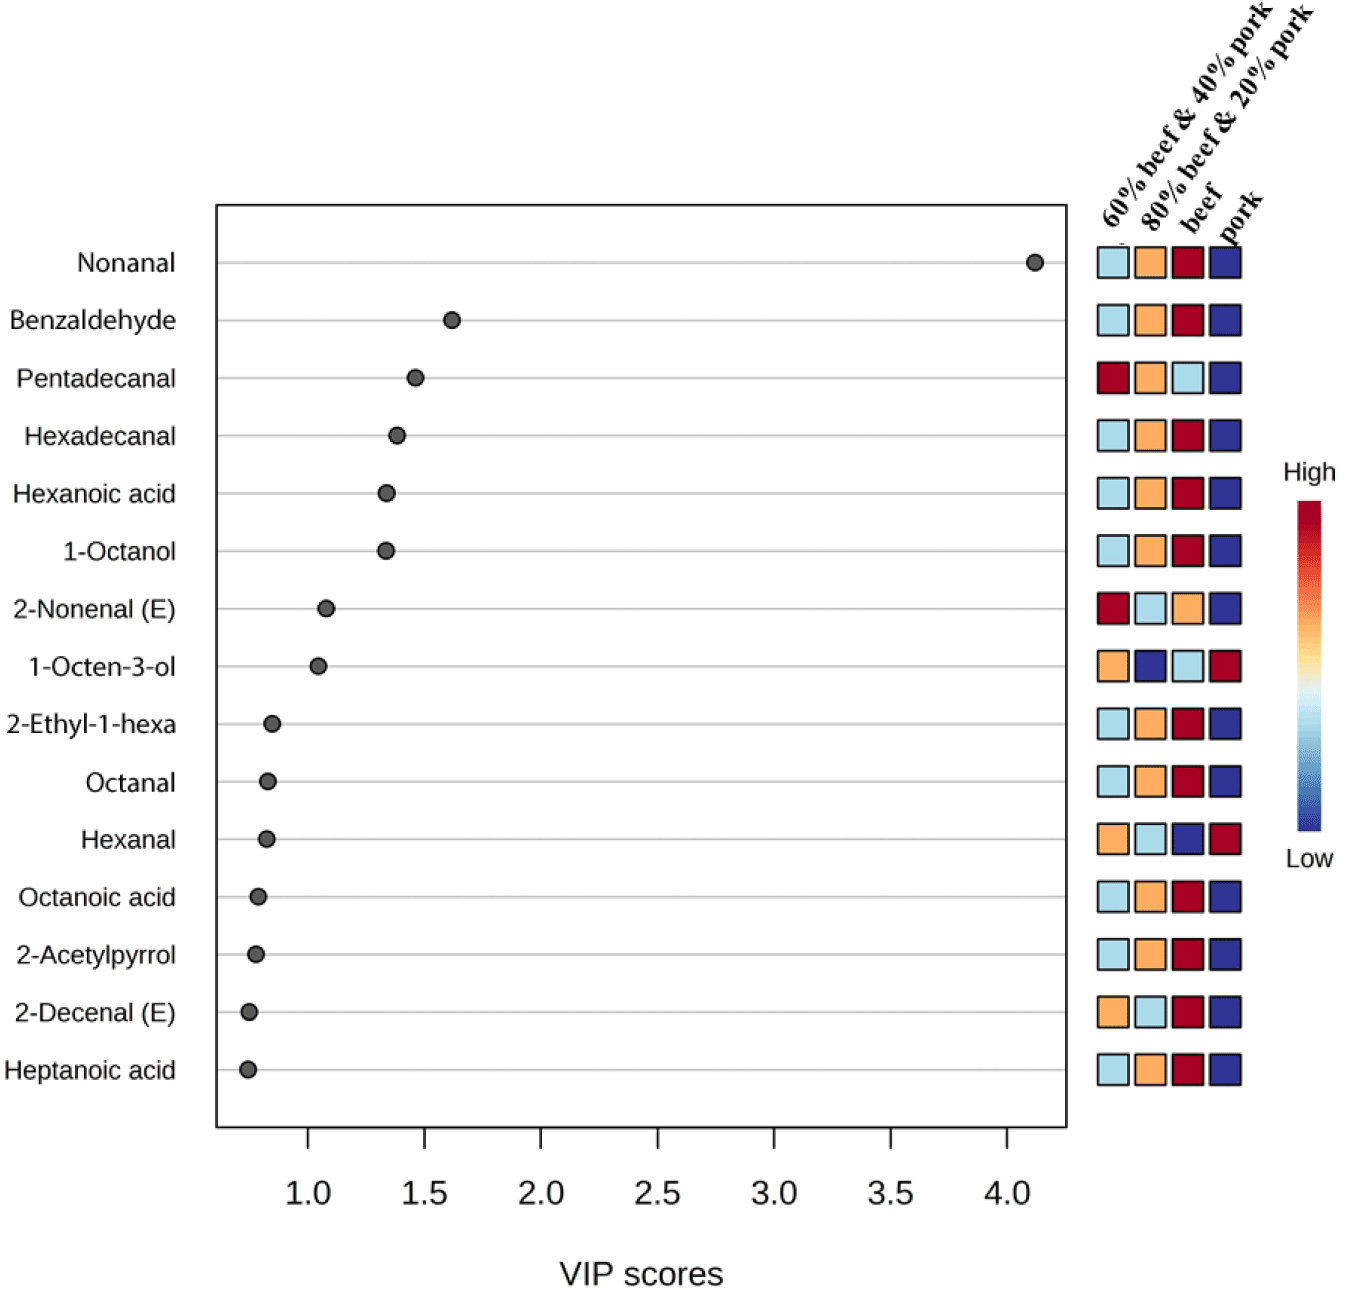
To identify volatile compounds suitable as markers, correlation coefficients, and variable importance in projection (VIP) values were extracted from the PLS-DA model (Amalia et al., 2022). Fig. 3 shows the top 15 compounds identified for each type of meat group with the highest VIP value. Compounds with a higher VIP score are important for the meat samples’ discrimination (Li et al., 2021a; Pranata et al., 2021). The top 15 compounds were nonanal, benzaldehyde, pentadecanal, hexadecanal, hexanoic acid, 1-octanol, 2-nonenal (E), 1-octen-3-ol, 2-ethyl-1-hexanol, octanal, hexanal, octanoic acid, 2-acetylpyrrole, 2-decenal (E), and heptanoic acid. The aldehyde, nonanal comes with the highest VIP value of 4.0 and is considered to have the highest influence in discriminating between the groups. Nonanal was present at a very high concentration in all the samples with the highest in beef. Previous studies also found nonanal contributes the highest to beef flavour (Ahamed et al., 2023; Vilar et al., 2022). In a study by Wu et al. (2022), nonanal was identified as a significant aroma compound in cooked pork, imparting a citrus and green-like aroma. Among the fifteen compounds identified, fourteen were derived from lipid degradation and categorized as aldehydes, alcohols, and acids. This observation aligns with findings from a review that summarized 332 compounds from various cooked meat species, highlighting the substantial contribution of lipid degradation compounds to the flavor of cooked meat (Sohail et al., 2022). In Fig. 3, the color legend on the right side, transitioning from blue to red, represents the increasing frequency values of the significant compounds in each category.
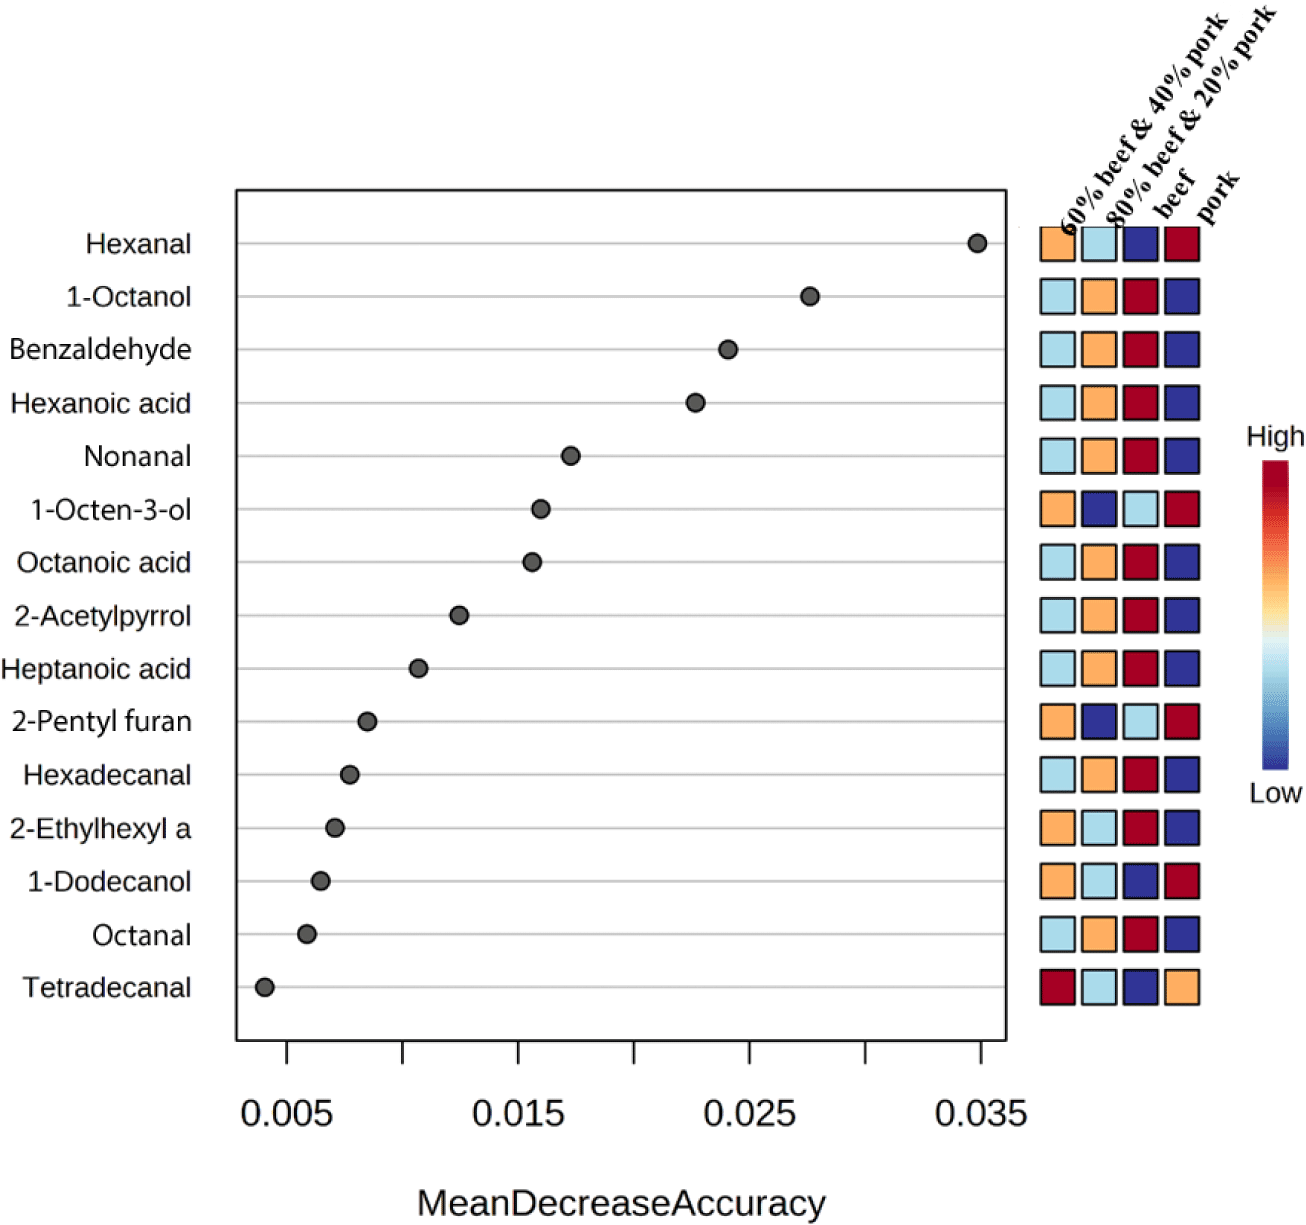
For further confirmation of the most significant compounds for discrimination, a random forest test was performed. Fig. 4 shows the 15 important volatiles that achieved higher significance in the random forest analysis than the other compounds. In beef, 1-octanol, benzaldehyde, hexanoic acid, nonanal, octanoic acid, 2-acetylpyrrole, heptanoic acid, hexadecanal, 2-ethylhexyl acrylate, and octanal were the most important volatiles, in the pork, hexanal, 1-octen-3-ol, 2-pentyl furan, and 1-dodecanol. Previous studies have identified benzaldehyde as a predominant and one of the most abundant aldehydes in grilled meat, and confirmed 2-acetylpyrrole as a highly predictive compound for beef, consistent with our findings (Wei et al., 2022). Nonanal, derived from the beta-oxidation of oleic acid, is a key compound in cooked beef and is positively correlated with cooked beef flavor (Li et al., 2021b; Wu et al., 2022). However, one research reported that nonanal was a strong marker and positively correlated with meatballs made of beef and wild boar mixture (Amalia et al., 2022). This may occur due to the different volatile profiles of wild boar. In one study, octanal and 1-octanol were found to be positively correlated with beef (Pavlidis et al., 2019), and many previous studies observed this aldehyde and alcohol as a major volatile compound in cooked beef (Sohail et al., 2022). The hexanal and 1-octen-3-ol are the major contributing volatile compounds in cooked pork but sometimes produce undesirable odor at higher concentrations (Han et al., 2020; Li et al., 2022; Wu et al., 2022). The 2-pentyl furan is important in pork flavour and is derived from linoleic acid oxidation (Wang et al., 2016). Tetradecanal is found to be an important metabolite of the 60:40 mixed sample. From the PLS-DA and random forest test, 11 compounds were identified as common in both models and are pretended to be the important compounds for the discrimination between the samples. The common compounds were hexanal, nonanal, octanal, hexadecanal, benzaldehyde, 1-octanol, 1-octen-3-ol, hexanoic acid, heptanoic acid, octanoic acid, and 2-acetylpyrrole.
Fig. 5 displays a heatmap depicting compounds that significantly influence the discrimination process, determined through Pearson correlation. The color chart on the right side illustrates the correlation strength. Notably, the heatmap reveals clear differentiation between pork and beef samples. Moreover, the mixed sample containing 80% beef and 20% pork exhibits a closer resemblance to beef’s volatile profile compared to the sample containing 60% beef and 40% pork, evident from the discernible color variation. Some compounds showed a higher correlation with beef and followed a trend of lowering in the mixed sample. Benzeneacetaldehyde, octanal, octanoic acid, 2-ethyl-1-hexanol, 2-undecenal, 1-heptanol, 2-ethylhexyl acrylate, 1-octanol, hexanoic acid, and 2-decenal (E) are highly positively correlated with beef samples and in the sample of (80% beef and 20% pork) their concentration becomes a little lower than the pure beef, and again it becomes lower in (60% beef and 40% pork) samples. Nonanal, benzaldehyde, heptanoic acid, hexadecanal, 2-nonenal (E), heptanal, 2-acetylpyrrole, and acetophenone also positively correlated with beef samples. Previous studies also found octanal, heptanal, nonanal, 1-hexanol, 1-octanol, and benzaldehyde were positively correlated with beef (Pavlidis et al., 2019). Hexanal, 1-octen-3-ol, 3-ethyl-2,5-dimethyl pyrazine, and 1-dodecanol were highly positively correlated with pork samples. Hexanal, one of the major volatiles in pork, comes from the degradation of a major polyunsaturated fatty acid, found at a very high concentration and has a strong correlation with pork (Li et al., 2022; Pavlidis et al., 2019). 1-Octen-3-ol was also previously identified as a positively correlated biomarker for pork (Pavlidis et al., 2019; Shi et al., 2019; Vilar et al., 2022). However, one study indicated heptanal as a major discriminatory compound for pork which is different from our findings (Nurjuliana et al., 2011). Pentadecanal, tetradecanal, and 1-formylpyrrolidine showed a positive correlation with (60:40) mixed samples. Sometimes during the cooking of adulterated meat, compound-compound interaction can happen and some compound concentrations are increased greatly rather than presented in the pure sample (Pavlidis et al., 2019). And, this effect may happen with the above-mentioned three compounds in the mixed sample (60:40 ratio). The heatmap showed that beef and pork have a different volatile profile, which may be due to their eating habit. Cattles are mainly herbivores and pigs are omnivores (Sohail et al., 2022). Moreover, pigs possess a more complex digestive system, which can be evident in their ability to absorb carbon and nitrogen-containing compounds, a significant portion of which originate from microorganisms (Trivedi et al., 2016).
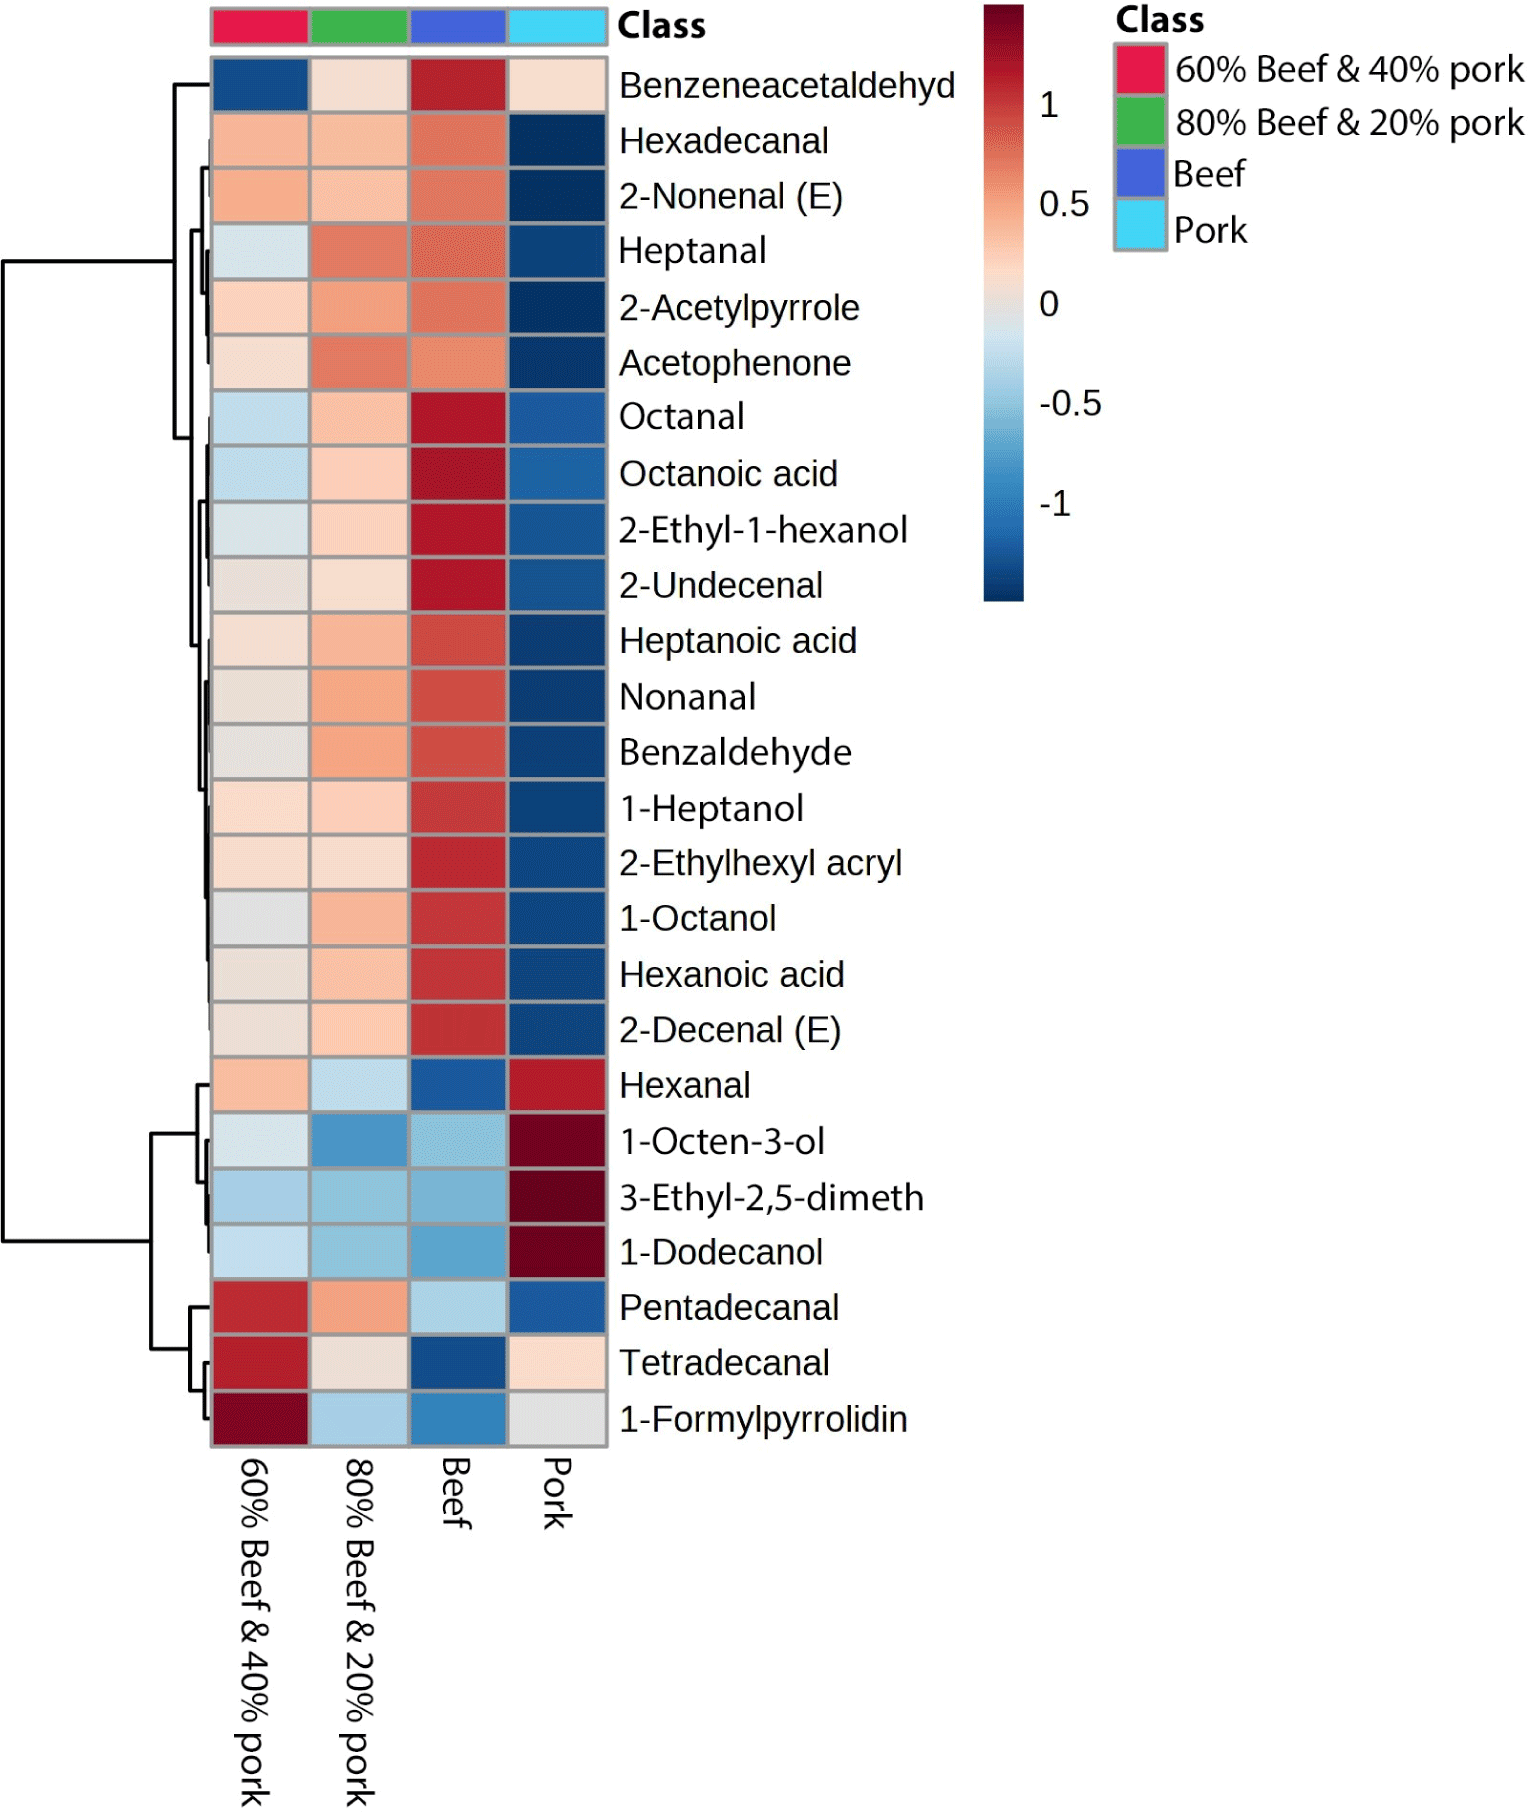
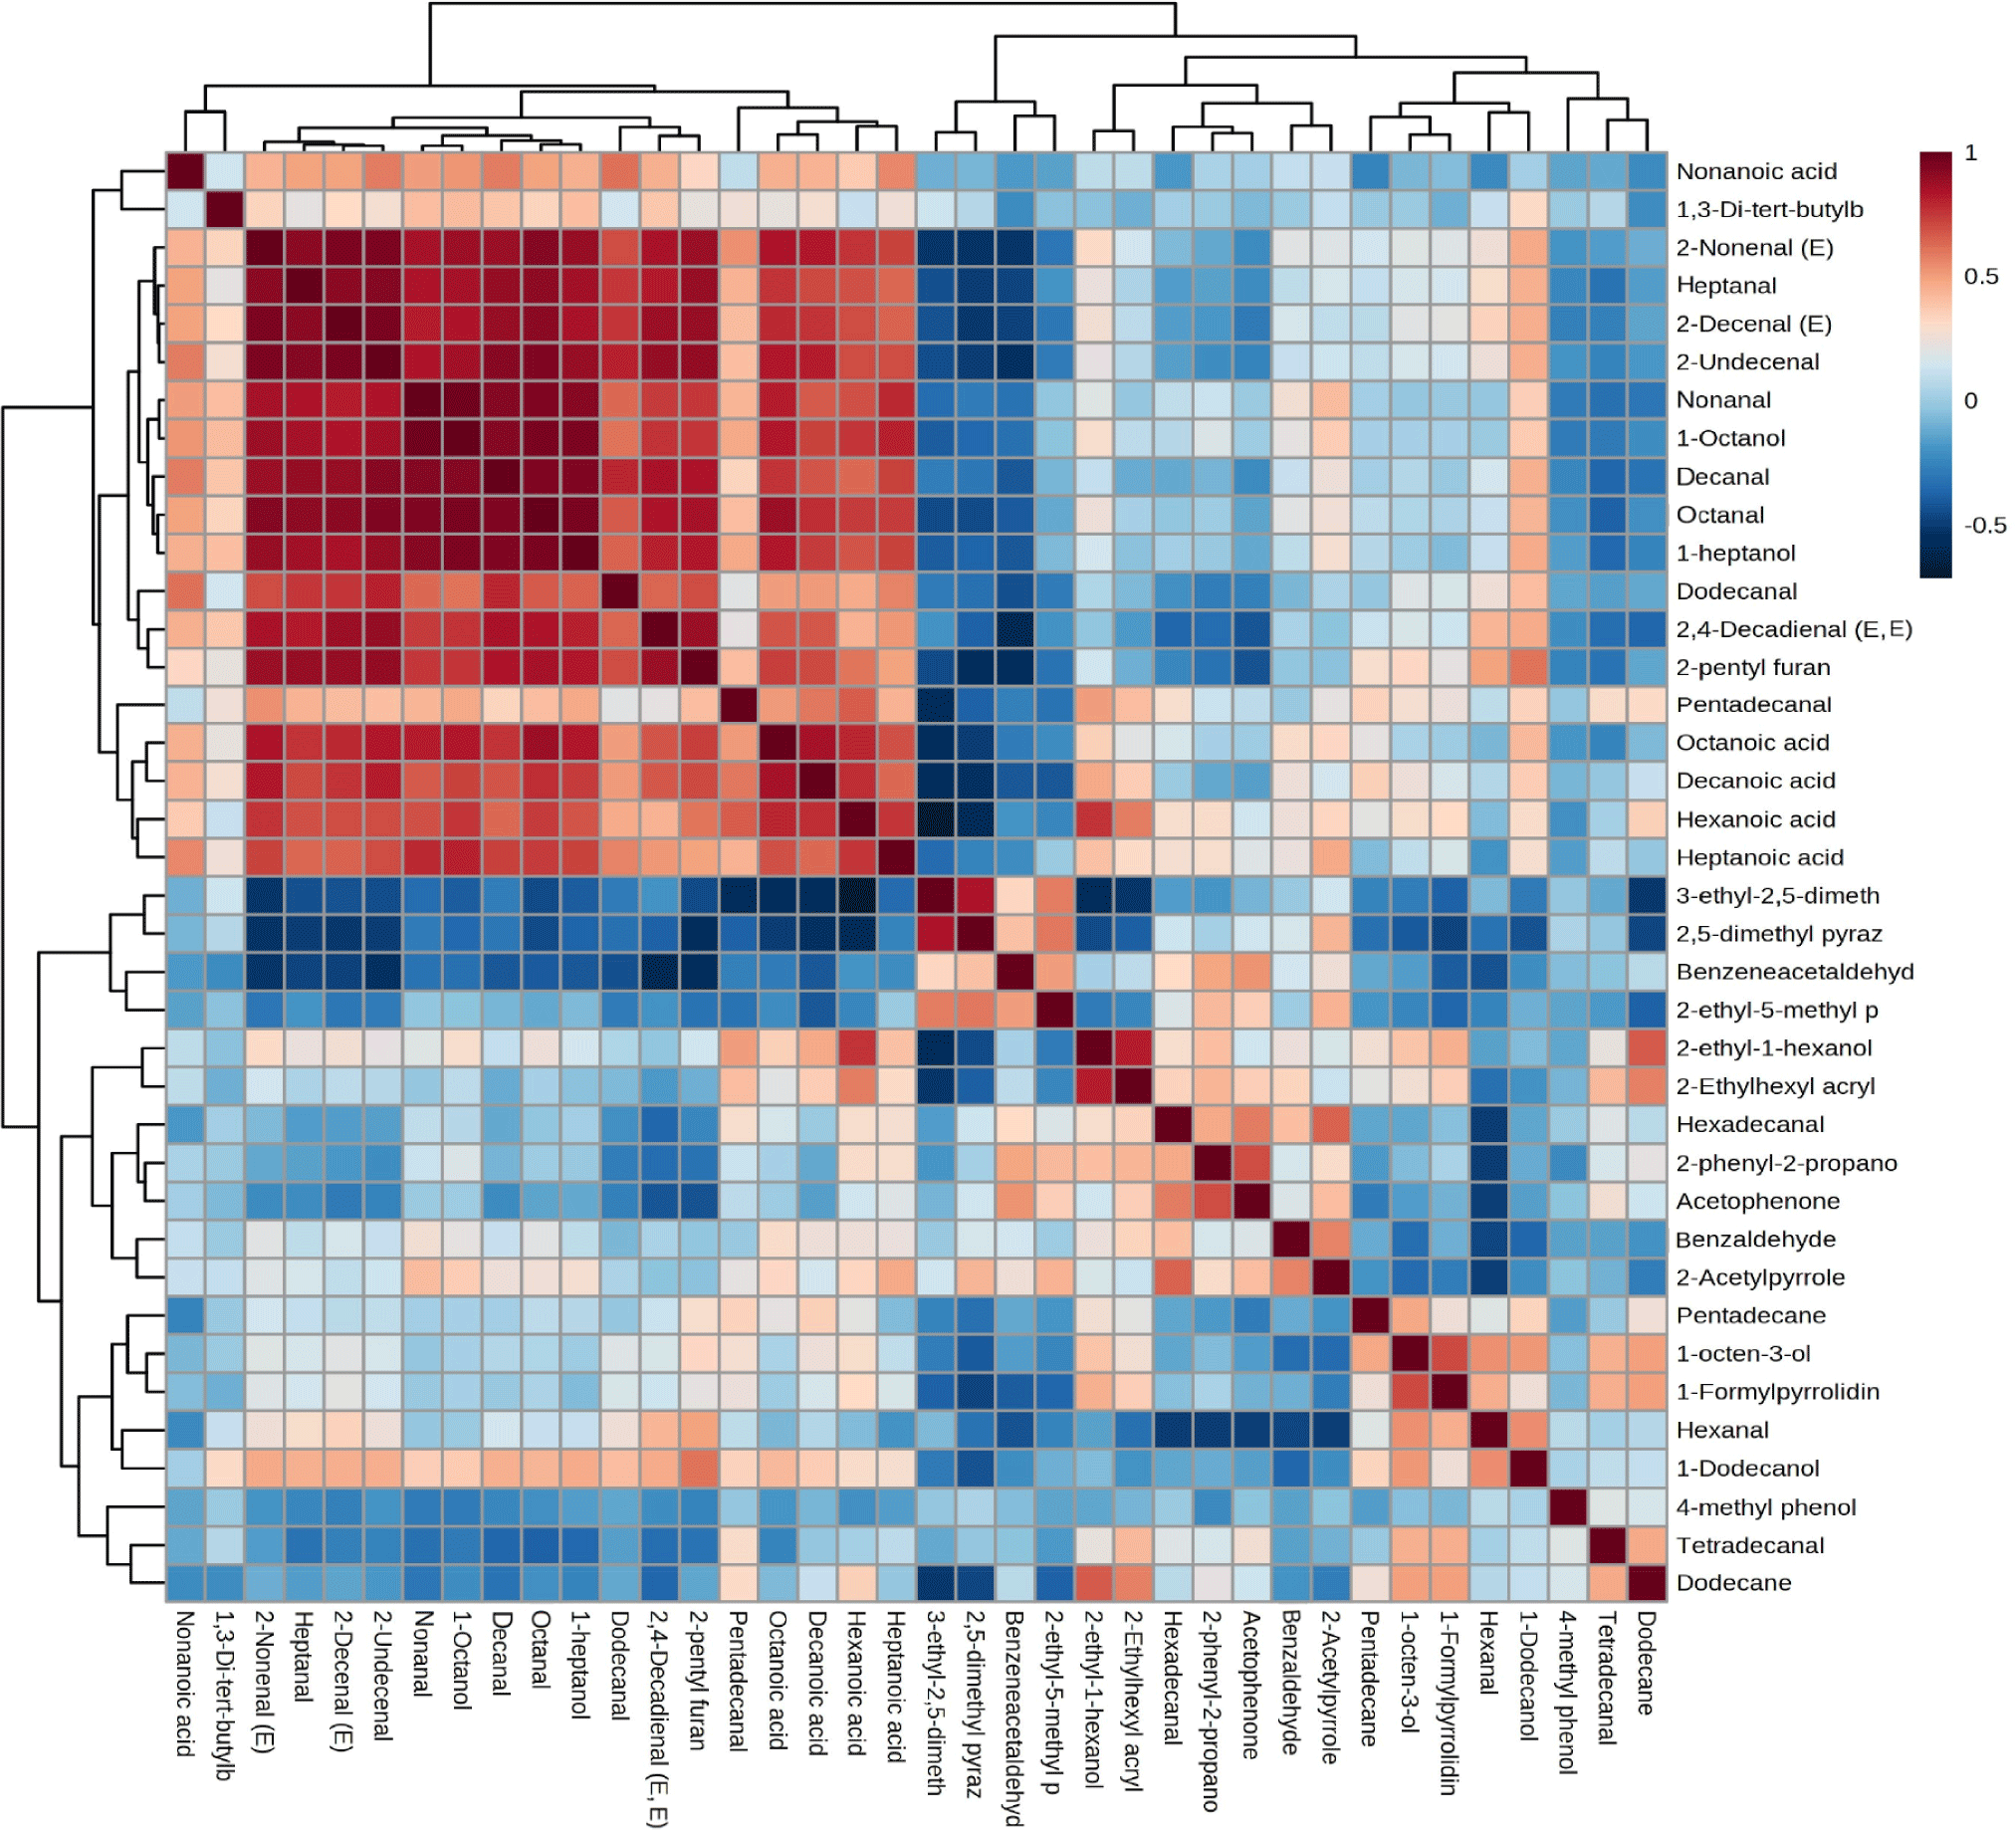
Fig. 6 shows the correlation matrix of 38 compounds between the pure beef, pork, and mixed samples. Using the statistical module of MetaboAnalyst, we identified groups of normalized metabolites that exhibit either positive or negative correlations, regardless of the specific samples they come from. Color-coding represents these correlations visually: positive correlations are shown in brown, while negative correlations are displayed in blue. The intensity of the colors corresponds to the strength of the correlation. A big cluster of positively correlated compounds accompanied by three minor ones was found. 2-Nonenal, heptanal, 2-decenal (E), 2-undecenal, nonanal, 1-octanol, decanal, octanal, 1-heptanol, dodecanal, 2,4-decadienal (E,E), and 2-pentyl furan created the big cluster and had the highest positive correlation among them irrespective of their origin (meat type). Most of these positively correlated compounds also belong to the aldehydes, alcohols, and acids, which are compounds derived from lipid oxidation.
Conclusion
In conclusion, this study demonstrates the potential of HS-SPME-GC-MS as a reliable and efficient method for analyzing volatile compounds in cooked meat, enabling the classification of meat types and detection of adulteration. Both PCA and PLS-DA analyses revealed distinct separation among pure beef, pure pork, and mixed samples, with the position of adulterated samples influenced by the percentage of added pork. Some key compounds, including aldehydes, alcohols, and acids exhibited higher discriminatory power. This study underscores the potential of volatilomics-based techniques with chemometrics analysis in addressing meat and meat product adulteration and fraud labeling, though further research is essential to account for various factors affecting volatile compounds and establish a universal model and detecting at a very low level of adulteration.


