Introduction
In bovine milk, functional proteins, such as lactoferrin, immunoglobulins, and growth factors secreted from the mammary gland exist in an active state and exert biological activity. Milk proteins are superior in nutritional value alone, but they are attracting more attention for their physiological roles and are currently recognized as sources of various biologically active peptides (Pihlanto, 2006).
Bioactive peptides are isolated portions of proteins that have beneficial effects on various physiological functions and physical and mental health. These peptides have positive effects on antioxidant, antithrombotic, antihypertensive, antibacterial, and immunomodulatory properties, and have received considerable attention for their potential bioactivities (Lin et al., 2022). Recent studies have suggested that bioactive peptides may have positive effects on diseases such as obesity and hyperlipidemia (Song et al., 2022).
Cheese is a widely consumed dairy product that is highly regarded for its unique flavor, pleasing texture, and rich nutrients. It is a notable reservoir of proteins, fats, vitamins, and minerals. Cheese is high in protein and is a source of various milk derived peptides, depending on the diversity of proteolytic systems and the intensity of proteolysis during ripening (Park et al., 2007). Enzymes present in milk, derived from rennet or secreted by microorganisms, can break down casein and produce bioactive peptides (Pihlanto, 2006). The degradation of milk proteins is affected by several factors like pH, plasmin, chymosin, enzymes secreted by microorganisms, salt, storage period and temperature, and humidity (Park and Jin, 1998).
The physiologically active peptide content of cheese is enhanced by the specific probiotic strains used in the cheese manufacturing process and ripening. Studies on Cheddar cheese have shown that the use of Lactobacillus casei 300 results in peptides having antihypertensive activity (Giosuè et al., 2022). Moreover, it has been demonstrated that the use of specific proteases in cheese production further increases the appearance of bioactive peptides. Therefore, even in the same type of cheese, the type, amount, and function of bioactive peptides are likely to vary depending on the degree of ripening.
Cheddar cheese is a hard, mostly orange-colored, natural cheese. It is known to have originated from the English town of Cheddar in Somerset. Cheddar is the most popular cheese type in the UK, and accounts for 51% of the annual cheese market. In the United States, cheddar is the 2nd most consumed cheese after mozzarella, and the average annual consumption per person is 10 pounds (4.5 kg). Likewise, cheddar is a type of cheese that is easily accessible and loved in many countries.
Therefore, research on Cheddar cheese peptides according to ripening stage is expected to reveal changes in composition and functionality at each stage, and based on this, its value as a fermented food will be reaffirmed. Our study focused on evaluating the anti-inflammatory effect, antioxidant, and antihypertensive functions of Cheddar cheese, a commonly consumed cheese, at different ripening stages.
Materials and Methods
In this study, extra-sharp (3-year-ripened), medium (6-mon-ripened), and young (early stages of ripening, 1-mon-ripened) Cheddar cheeses manufactured by the Animal Resources Research Center of Chungnam National University, Korea, were used as samples and categorized into the extra-sharp Cheddar cheese water-soluble extract (EC), medium Cheddar cheese water-soluble extract (MC), and young Cheddar cheese water-soluble extract (YC) groups, respectively. Each cheese sample was finely ground, and 20 g was placed into 180 mL of distilled water (DW) and extracted with an ultrasonic extractor (1 h, 40°C). Each water-soluble extract (WSE) was cooled and centrifuged (Supra R17, Hanil Science, Ansan, Korea) at 6,000×g (20 min, 4°C) to remove the fat layer, and the WSEs was taken and filtered with Whatman No. 2 (Whatman, Maidstone, UK). Finally, the WSE was lyophilized and kept at −20°C until further analysis.
To evaluate the ripeness of Cheddar cheese, the nitrogen fraction quantification method (Bütikofer et al., 1993) was applied to measure the change in water-soluble nitrogen (WSN).
Each cheese was finely grinded, mixed in a ratio of 5 g of cheese to 20 mL of sterilized DW, and homogenized at 20,000 rpm for 5 min with a homogenizer (ULTRA TURRAX T25, IKA, Wilmington, NC, USA). It was centrifuged at 4°C, 3,000×g for 30 min to remove the fat, and the supernatant was filtered with by Whatman No. 2 (Whatman).
Subsequently, following Hull's method (Hull, 1947), 2.5 mL of the filtrate was combined with 5.0 mL of reagent A (12% trichloroacetic acid and 0.5 mL of DW). The mixture was left at room temperature for 20 min and then filtered with Whatman No. 42 (Whatman) to obtain filtrate. Then, 2.5 mL of filtrate was taken, 5.0 mL of Reagent B (75 g of sodium carbonate and 10 g of sodium hexametaphosphate dissolved in 500 mL of DW) and 1.5 mL of Reagent C [50 mL of folin & Ciocalteu′s phenol reagent (Sigma-Aldrich, St. Louis, MO, USA) dissolved in 100 mL of DW] and reacted for 30 min in a 30°C water bath. After the completion of color development, the WSN content was measured at 570 nm using a spectrophotometer (UV-1700, Shimadzu, Kyoto, Japan), and their quantification was calculated by a linear regression formula with tyrosine as the standard.
Protein quantification and pH measurements were performed to confirm the protein content and characteristics of Cheddar WSEs used in this study. The protein content of Cheddar WSEs were measured using the protein quantification method (Bradford, 1976). Lyophilized WSE diluted in sterilized DW at a concentration of 10 mg/mL was used as a measurement sample. Protein Assay Dye Reagent Concentrate (Bio-Rad Laboratories, Hercules, CA, USA) was diluted with DW in a 1:4 ratio and used as Bradford dye reagent. Measurements were made by placing 10 μL of sample solution and 200 μL of dye reagent in each well of a 96-well plate and measuring absorbance at 595 nm with microplate reader. Afterwards, bovine serum albumin (BSA, Bio-Rad Laboratories) was used as a standard substance to quantify the protein content in the sample.
The pH measurement was performed by mixing YC, MC, and EC lyophilized substances with DW at a concentration of 2% (w/v) and measuring at 25°C with a pH meter (S-20K, Mettler-Toledo, Columbus, OH, USA).
Cheddar WSE was dissolved in DW at a concentration of 100 ppm, filtered with a 0.2 μm syringe filter (HM, Anseong, Korea), and used for ultra performance liquid chromatography-high resolution mass spectrometer (UHPLC-HRMS) analysis. HRMS (TripleTOF 5600 plus, SCIEX, Framingham, MA, USA) detector and UHPLC system (1290 Infinity II, SCIEX) were used for analysis. Chromatography was performed using a 2-solvent gradient elution [solvent A: 0.1% formic acid in deionized water (v/v), solvent B: 0.1% formic acid in acetonitrile (v/v)]. The mass spectrometer was operated in (+) ion mode. Data were analyzed using AB SCIEX software. Information on milk-derived peptides was collected from the Milk Bioactive Peptide Database (https://mbpdb.nws.oregonstate.edu/) and analyzed.
The 2,2′-azino-bis-(3-ethylbenzothiazoline-6-sulfonic) acid (ABTS) radical scavenging was measured using a decolorization assay (Re et al., 1999). The ABTS radical solution was prepared by reacting the ABTS (Sigma-Aldrich) solution (7 mM) with potassium persulfate solution (2.4 mM), keeping the mixture in the dark at 25°C for 12–16 h before use. The ABTS radical solution was diluted with DW to an absorbance of 0.7 (±0.02) at 734 nm. A 50 μL sample was mixed with 950 μL of diluted ABTSo+ solution, and the absorbance (734 nm) was measured after 10 min. L-ascorbic acid was used as a positive control, and the rate of inhibition was calculated as follows:
Inhibition of 2,2-diphenyl-1-picrylhydrazyl (DPPH) by cheddar cheese was evaluated using a modified free radical method (Brand-Williams et al., 1995). The sample diluted in 20 μL of DW was dispensed into a 96-well plate with 180 μL of freshly prepared 0.2 mM DPPH (Sigma-Aldrich) methanol solution. After reaction in the dark (15 min), the decrease in absorbance at 517 nm was measured using a microplate reader (Thermo Fisher Scientific, Waltham, MA, USA). In the same way, blank values were determined using DW. Scavenging rate was expressed as follows:
Where A is the absorbance of the sample and A0 is the absorbance of the blank.
Angiotensin-converting enzyme (ACE)-inhibitory activity was measured using an in vitro spectrophotometric assay (Cushman and Cheung, 1971) with some modifications. Rabbit lung acetone powder (Sigma-Aldrich) was mixed at 1:10 with 0.1 M sodium borate buffer containing 0.3 M NaCl and extracted by shaking at 4°C for 24 h. After centrifugation at 15,000×g for 30 min, the supernatant was collected and used as the ACE enzyme. As a substrate, hippuryl-histidyl-leucine (HHL, Sigma-Aldrich) was diluted to a concentration of 5 mM in 0.1 M sodium borate buffer containing 0.3 M NaCl. Captopril (Sigma-Aldrich) was used as the positive control. Then, 100 μL of 0.1 M sodium borate buffer and 50 μL of ACE enzyme were added to 50 μL of the sample, which was preincubated at 37°C for 5 min, after which 50 μL of substrate was added and reacted at 37°C for 30 min. After the reaction, 300 μL of 0.1 N HCl was added to stop the reaction, followed by adding 1 mL of ethyl acetate, stirring for 15 s, and centrifugation at 4°C and 960×g for 5 min. The supernatant was completely dried in a vacuum concentrator (Hanil, Daejeon, Korea), 1 mL of DW was added, and the absorbance was measured at 228 nm. A sample blank was prepared by stopping the reaction with 300 μL of 0.1 N HCl before adding the ACE enzyme. The rate of inhibition was calculated as described in the ABTS assay.
RAW 264.7 cells, purchased from the Korean Cell Line Bank, were used in the experiments. The cells were cultured in Dulbecco’s modified Eagle’s medium (DMEM, WELGENE, Gyeongsan, Korea) supplemented with 10% (v/v) of fetal bovine serum (FBS, WELGENE), and 1% (v/v) of penicillin and streptomycin (WELGENE). The cells were cultured under conditions at 37°C and 5% CO2.
To determine the effect of Cheddar WSE on cell activity, a 3-(4,5-dimethylthiazol-2-yl)-5-(3-carboxymethoxyphenyl)-2-(4-sulfophenyl)-2H-tetrazolium inner salt (MTS) assay was performed. RAW 264.7 cells were seeded in a 96-well plate at 3,000 cells/well and cultured for 24 h. The samples were treated at each concentration in each well and cultured for another 24 h. Subsequently, MTS solution (Promega, Madison, WI, USA) was added to each well, and the absorbance was measured at 490 nm with microplate reader (EMax Plus, Molecular Devices, San Jose, CA, USA). The relative toxicity was measured by expressing the activity of cells treated with the sample as a percentage of the untreated control group.
RAW 264.7 cells were seeded on a 6-well plate at 1.5×10⁵ cells/well and cultured for 24 h. The cultures were then replaced with culture medium treated with YC, MC, or EC WSE at a concentration of 100 μg/mL, or with untreated culture medium, and cultured for 24 h. Subsequently, each well was treated with 1 μg/mL lipopolysaccharide (LPS) and cultured for 6 h. After complete removal of the culture medium, the cells were washed with PBS, lysed with 1 mL of Ribo Ex (Gene All, Seoul, Korea), and RNA was extracted using a Hybrid-R RNA purification kit (Gene All). To synthesize cDNA, RNA was quantified using a Nabi UV/Vis Nano Spectrophotometer (Micro Digital, Seongnam, Korea). Then, 1 μL of random hexamer (100 pmol/μL) and 1 μL of dNTP mix (10 mM) were added to 1 μg of total RNA, and the total volume was adjusted to 10 μL using DEPC-treated water. The mixture was reacted at 65°C for 5 min and immediately cooled on ice. Subsequently, 1 μL of M-MLV reverse transcriptase (Promega), 4 μL of 5X M-MLV RT reaction buffer (Promega), 1 μL of RNase inhibitor (Enzynomics, Daejeon, Korea), and 4 μL of DEPC-treated water were added. After incubating at room temperature for 10 min, cDNA was synthesized by reacting at 50°C for 1 h.
The mRNA expression levels of inflammatory cytokines were compared using quantitative real time polymerase chain reaction (qRT-PCR). After diluting 2 μL of cDNA to 1/10, qRT-PCR was performed using 5 μL of nuclease-free water, 10 μL of 2X Prime Q-master Mix (GenET BIO, Nonsan, Korea), 10 pmol/μL forward primers, and 10 pmol/μL reverse primers. Using the AriaMx (Agilent, Santa Clara, CA, USA), 40 cycles of denaturation at 95°C for 20 s, annealing at 58°C for 20 s, and elongation at 72°C for 20 s were performed. The nucleotide sequences of the primers used in the experiment were as follows:
IL-1β: (F) 5'-AGG TCA AAG GTT TGG AAG CA-3', (R) 5'-TGA AGC AGC TAT GGC AAC TG-3'; IL-6: (F) 5'- GTC CTT CAG AGA GAT ACA GAA ACT-3', (R) 5'-AGC TTA TCT GTT AGG AGA GCA TTG-3'; TNF-α: (F) 5'-AGG GTC TGG GCC ATA GAA CT-3', (R) 5'-CCA CCA CGC TCT TCT GTC TAC-3'; iNOS: (F) 5'-CAG CTG GGC TGT ACA AAC CTT-3', (R) 5'-CAT TGG AAG TGA AGC GTT TCG-3'; GAPDH: (F) 5'-CCA TGG AGA AGG CTG GGG-3', (R) 5'-CAA AGT TGT CAT GGA TGA CC-3'.
RAW 264.7 cells were seeded on a 6-well plate at 1.5×10⁵ cells/well and cultured for 24 h. The culture medium was removed, and medium treated with or without YC, MC, and EC WSE at a concentration of 100 μg/mL was dispensed and cultured for 24 h. LPS was treated at a concentration of 1 μg/mL for 30 min. Then, each well was then immediately washed with ice-cold PBS, and lysates were extracted using lysis buffer [10 mM Tris-HCl (pH 7.5), 100 mM NaCl, 1 mM EDTA, 10% (v/v) glycerol, and 1% (v/v) Triton X-100]. Lysates were separated by sodium dodecyl sulfate-polyacrylamide gel electrophoresis (SDS-PAGE) for 1 h and transferred to a nitrocellulose membrane. Next, blocking was performed for 1 h with 5% (w/v) skim milk dissolved in PBST. The membrane was treated with antibodies against p-IκBα (1:1,000; Cell Signaling Technology, Danvers, MA, USA), IκBα (1:1,000; Cell Signaling Technology), and GAPDH (1:2,000; Cell Signaling Technology) for 12 h. After washing the membrane with PBST, the membrane was incubated with horseradish-conjugated secondary antibodies (Cell Signaling Technology) for 1 h, 25°C. Protein signals were detected using a Luminograph I (ATTO, Tokyo, Japan) after reacting the membrane with a SuperSignal (Thermo Fisher Scientific). The protein bands were quantified using ImageJ (NIH, Bethesda, MD, USA).
Results and Discussion
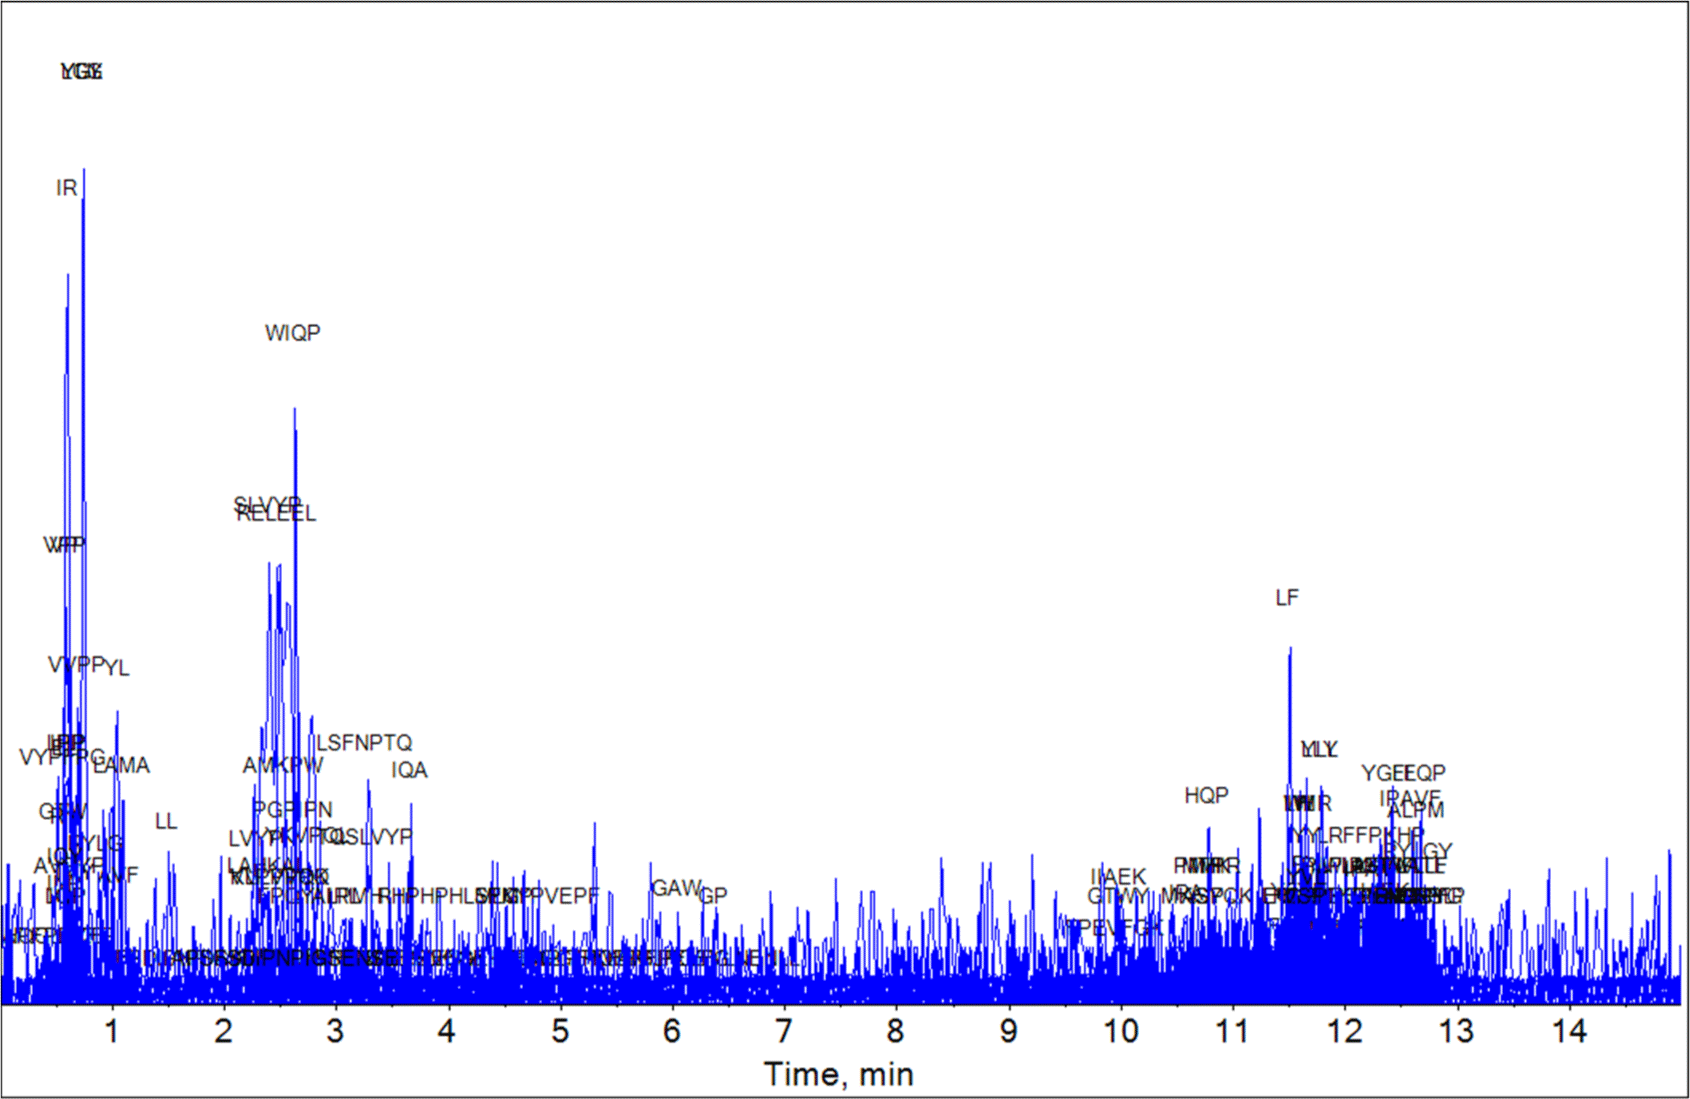
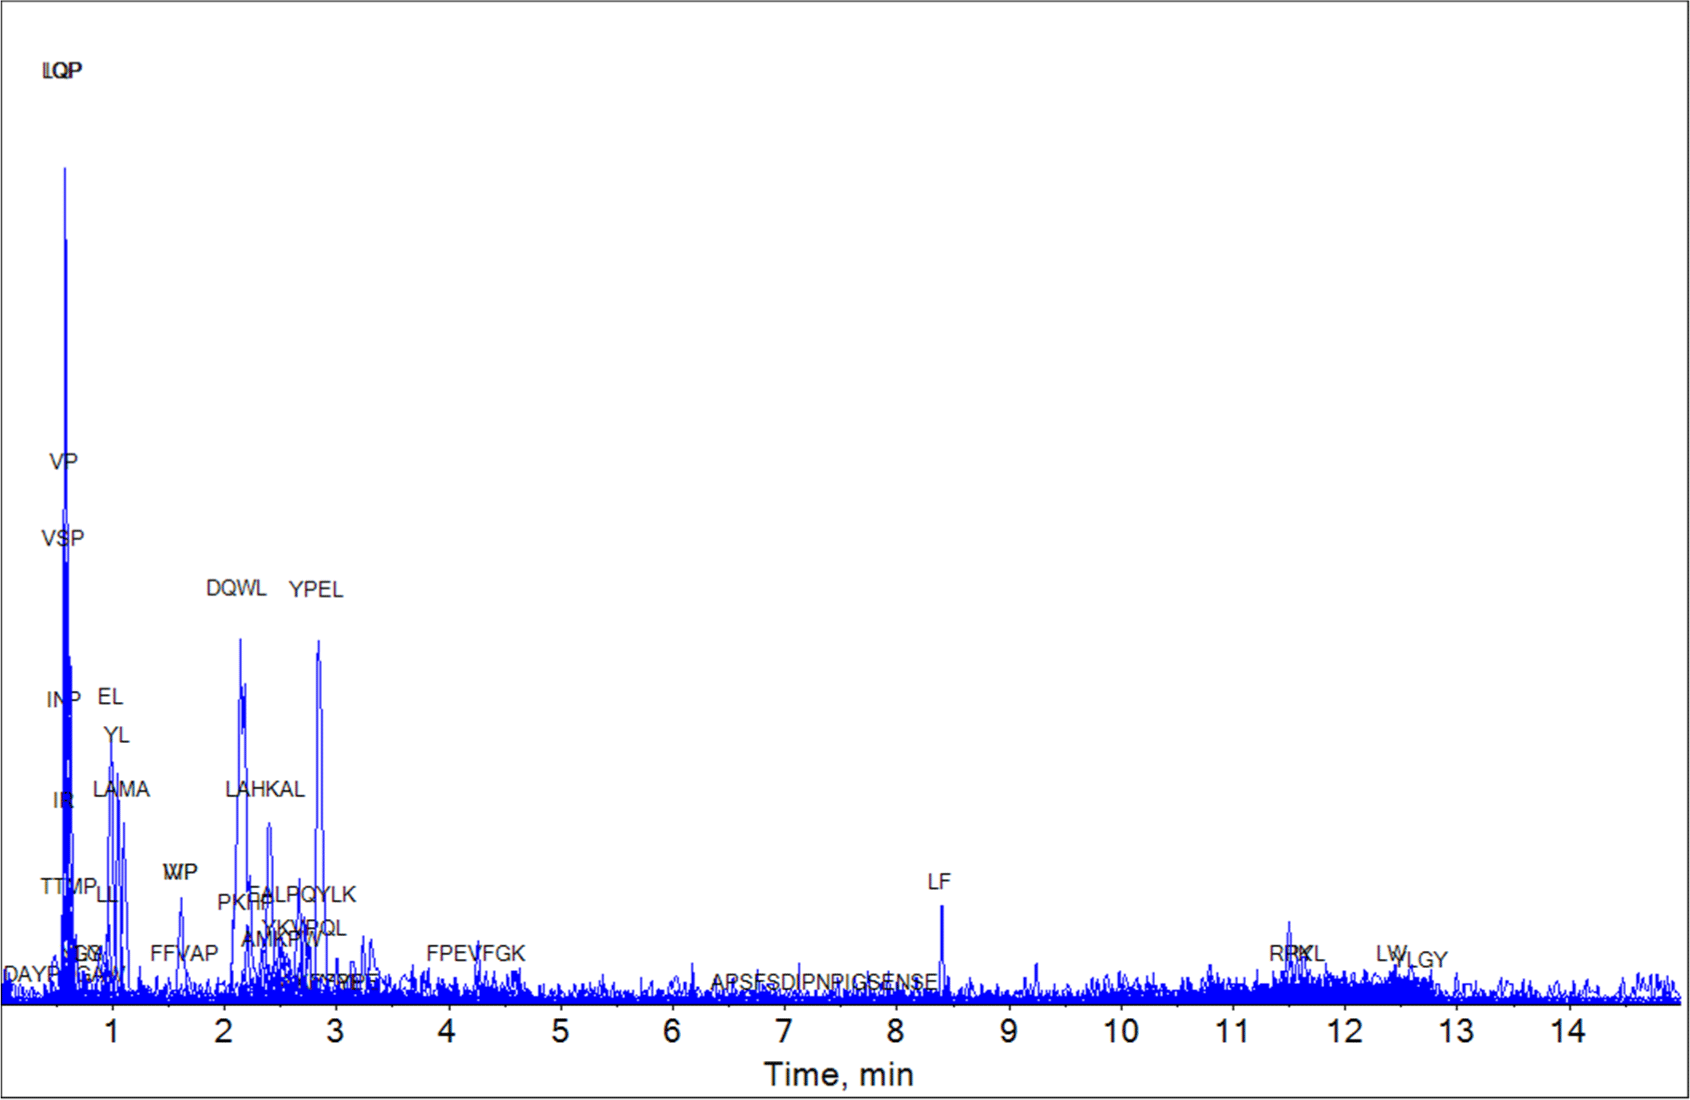
Using the UHPLC-HRMS technique, we analyzed the bioactive peptide composition of the YC, MC, and EC samples based on the milk-derived functional peptide database. The UHPLC-HRMS analysis result of the YC, MC, and EC samples are shown in Figs. 1, 2, and 3, respectively. The peptides matching the database comparison results and the known physiological activities of each peptide are shown in Tables 1, 2, and 3. For YC, which was in the early stages of ripening, two peptides (IQP and LQP) with ACE-inhibitory effects were identified by bioactive peptide comparison. In the case of MC (aged for 6 mon), LPP, which has an ACE-inhibiting effect, and IPP and VPP, which are known to have anti-inflammatory, antioxidant, and ACE-inhibiting effects, were discovered. In EC (aged for 3 years), various peptides were identified over the long protein degradation period, and several additional peptides (YKVPQL, LPP, VP, IR, LL, and VSP) were detected. Based on these results, EC, aged for 3 years, contained the most bioactive peptides were found among the three experimental groups. Thus, the results confirm that various bioactive peptides appear during long-term ripening.
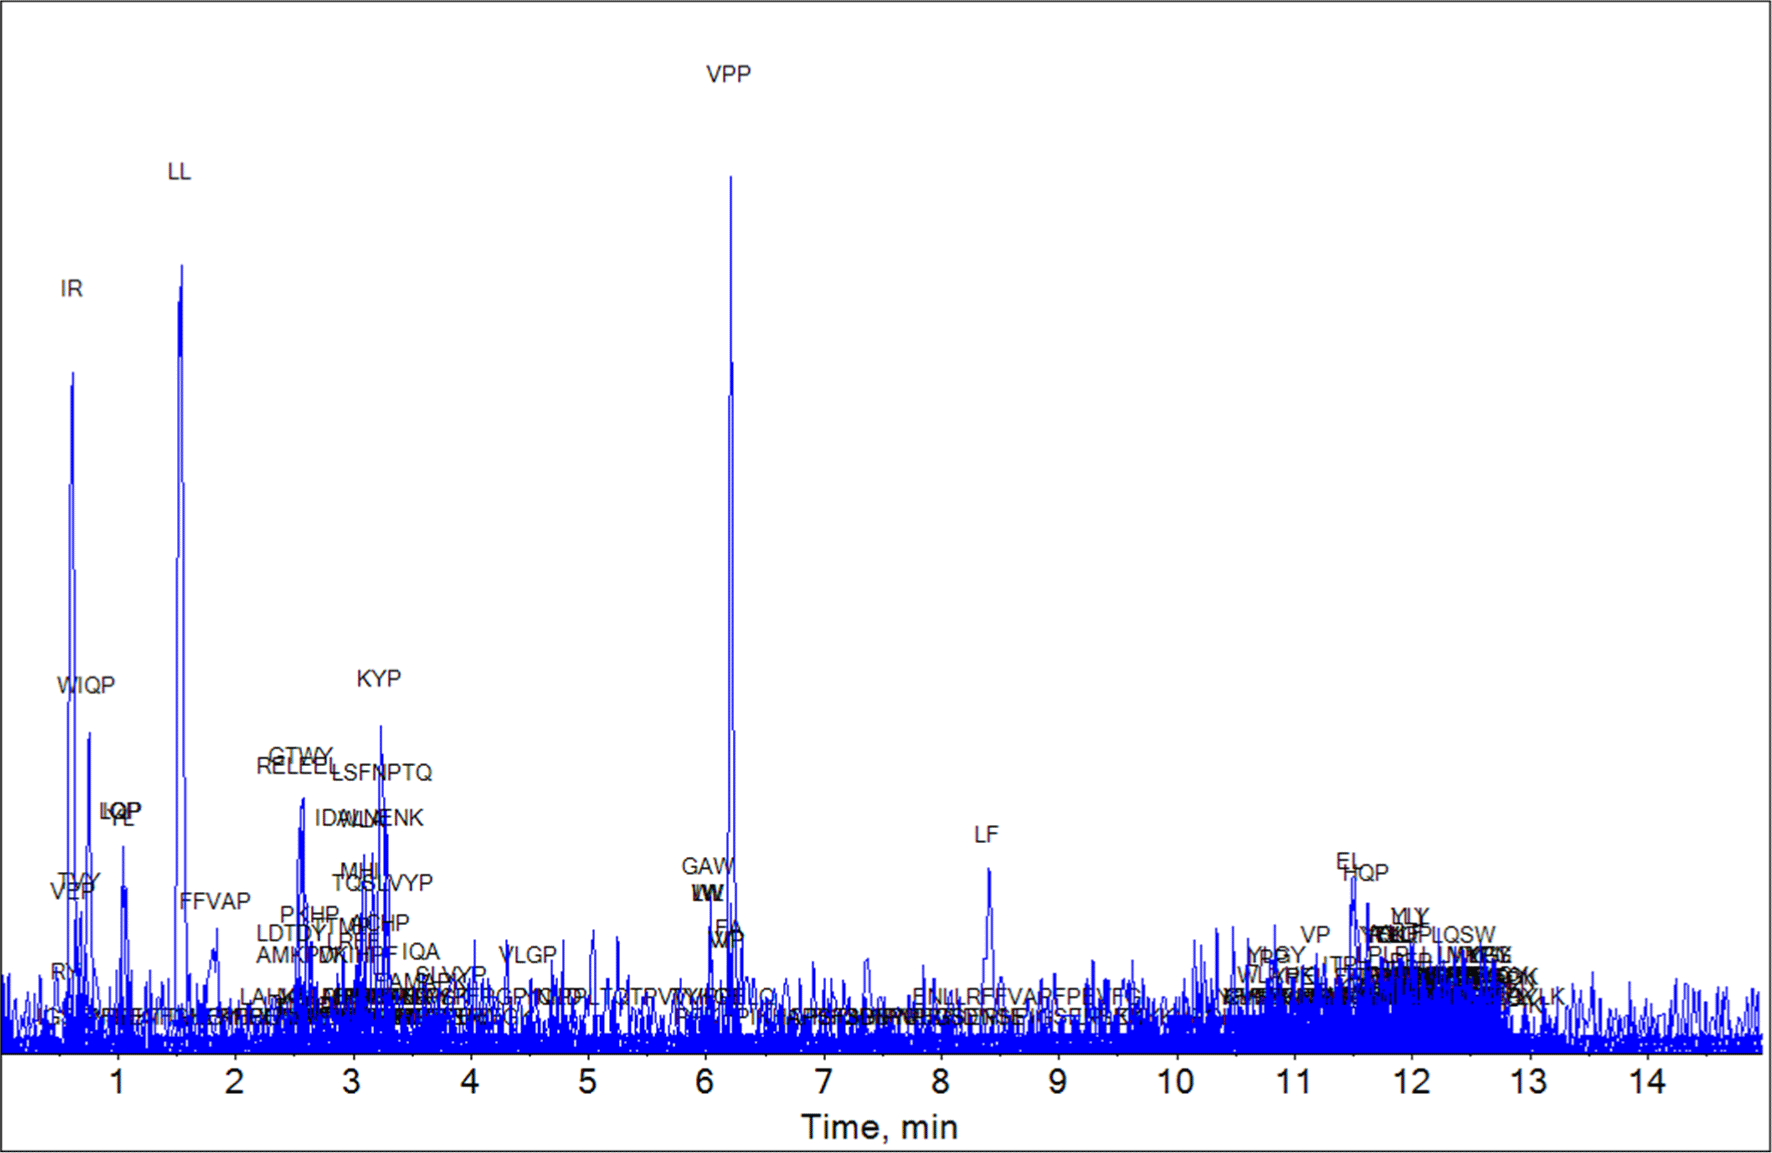
| Peptide | Protein description | Intervals | Function | Reference |
|---|---|---|---|---|
| IQP | αs2-CN | 209–211 | ACE-inhibitory | Jing et al. (2014) |
| LQP | β-CN | 103–105 | ACE-inhibitory | Tonouchi et al. (2008) |
| Peptide | Protein description | Intervals | Function | Reference |
|---|---|---|---|---|
| IPP | κ-CN | 129–131 | Antioxidant | Chakrabarti et al. (2017) |
| Anti-inflammatory | Adams et al. (2020) | |||
| ACE-inhibitory | Jing et al. (2014) | |||
| LPP | β-CN | 166–168 | ACE-inhibitory | Norris et al. (2014) |
| VPP | β-CN | 99–101 | Antioxidant | Chakrabarti et al. (2017) |
| ACE-inhibitory | Nakamura et al. (1995) | |||
| Anti-inflammatory | Aihara et al. (2014) |
| Peptide | Protein description | Intervals | Function | Reference |
|---|---|---|---|---|
| YKVPQL | αs1-CN | 119–124 | ACE-inhibitory | Maeno et al. (1996) |
| LPP | β-CN | 166–168 | ACE-inhibitory | Norris et al. (2014) |
| VP | β-CN | 23–24, 99–100, 188–189, 193–194 | ACE-inhibitory | Norris et al. (2014) |
| IR | β-LG | 163–164 | ACE-inhibitory | Murakami et al. (2004) |
| LL | β-LG | 4–5, 47–48, 73–74, 119–120 | ACE-inhibitory | Pan et al. (2012) |
| IPP | κ-CN | 129–131 | Antioxidant | Chakrabarti et al. (2017) |
| Anti-inflammatory | Adams et al. (2020) | |||
| ACE-inhibitory | Jing et al. (2014) | |||
| VSP | κ-CN Genetic Variant F1 | 169–171 | ACE-inhibitory | Weimann et al. (2009) |
The WSN content of Cheddar cheese gradually increased as the ripening period progressed (Table 4). The increase in WSN of cheese during the ripening period is generally caused by casein degradation and varies depending on the rennet used in cheese production or the protease secreted by the starter (Galán et al., 2008). In addition, it has been confirmed that protease produced from the cheese starter causes continuous protein degradation (Sallami et al., 2004). Therefore, the increase in WSN compounds is used as an indicator of ripening progress. In addition, the results of this study confirmed that WSN increases as the ripening period progresses from YC to MC and from MC to EC and is proportional to the degree of ripening.
| Sample | Water-soluble nitrogen content (μg tyrosine/g) | |
|---|---|---|
| Average | SEM1) | |
| Young Cheddar | 20.74 | 0.58 |
| Medium Cheddar | 95.18 | 0.13 |
| Extra-sharp Cheddar | 132.13 | 0.83 |
The protein content and pH value of each Cheddar cheese WSE are shown in Table 5. Each sample was compared after completely dissolving the freeze-dried powder in DW at a certain concentration. As a result, the protein content in YC was 20.01 mg BSA/g DM, and MC and EC were slightly reduced to 19.66 mg BSA/g DM and 16.63 mg BSA/g DM, respectively.
| Sample | Protein content (mg BSA/g DM) | pH (2% dissolved in DW) | ||
|---|---|---|---|---|
| Average | SEM1) | Average | SEM1) | |
| YC | 20.01 | 0.55 | 5.69 | 0.02 |
| MC | 19.66 | 0.02 | 5.71 | 0.01 |
| EC | 16.63 | 0.07 | 5.57 | 0.01 |
The pH value of Cheddar cheese WSE showed no difference from YC (5.69) in MC (5.71), but decreased to 5.57 in EC.
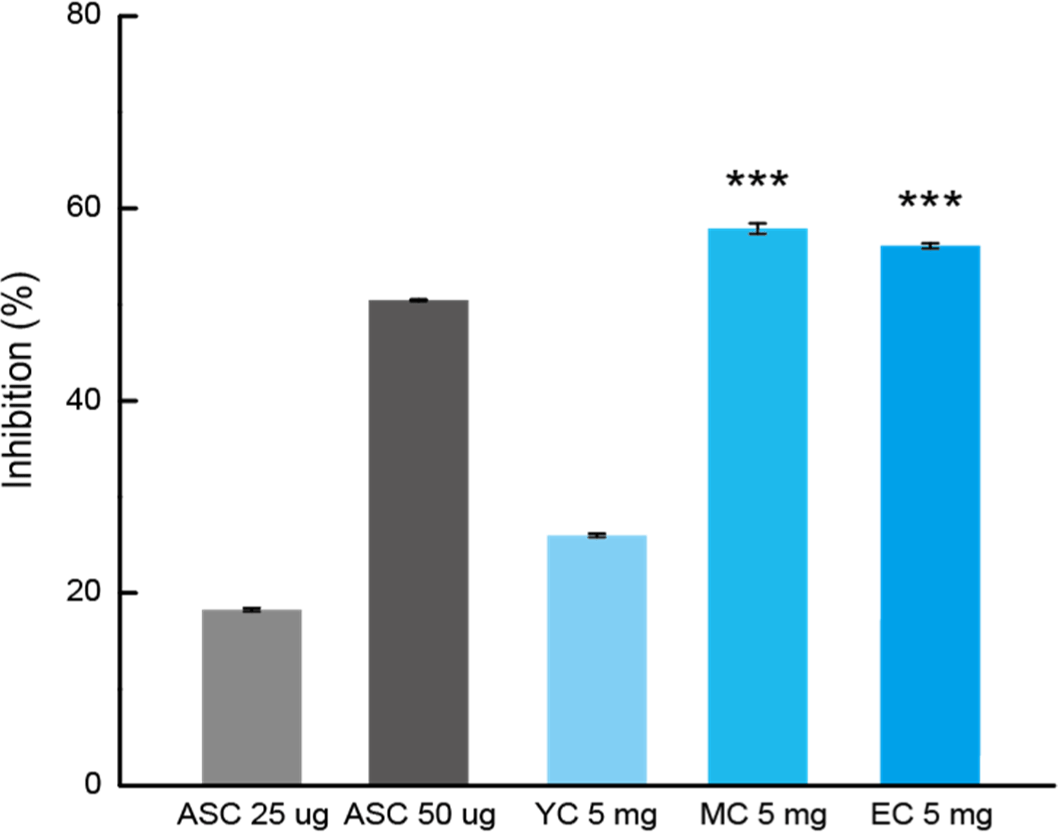
The ABTS radical inhibition rate (%) was compared by treating each sample at the same concentration, as shown in Fig. 4. YC exhibited a scavenging activity of 25.99±0.18%. On the other hand, MC and EC, which underwent longer ripening, demonstrated significantly higher scavenging activities of 57.90±0.54% and 56.08±0.26%, respectively.
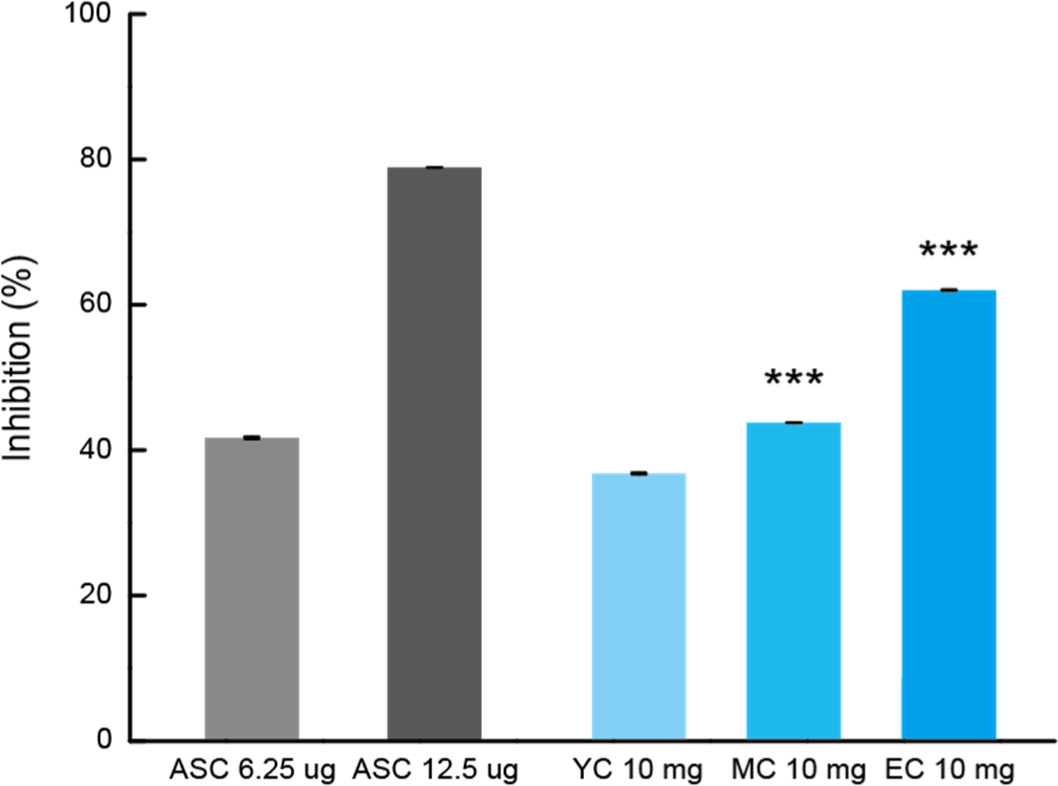
The DPPH radical scavenging ability of Cheddar cheese tended to increase gradually with the maturation period, as shown in Fig. 5. At the beginning of ripening (YC), the activity was 36.77±0.14%; in the middle (MC), it was 43.73±0.06%; and after 3 years (EC), it was 62.00±0.10%. Similar to the ABTS assay results, the DPPH radical scavenging ability was higher in MC and EC compared to YC. However, unlike the ABTS assay, EC showed the highest radical scavenging ability, demonstrating excellent DPPH scavenging activity. DPPH inhibition rate, and its activity gradually increased with the ripening period. These results are believed to be related to the presence of peptides (IPP and VPP) with antioxidant activity, as previously confirmed by the Bioactive Peptide Profile. In addition, it was confirmed that Cheddar cheese has excellent antioxidant ability through ripening.
The antihypertensive properties of Cheddar WSEs were estimated based on their inhibitory effects on ACE activity. This enzyme functions to convert angiotensin I to angiotensin II, which produces a powerful vasoconstriction effect and increases blood pressure by inactivating bradykinin, which acts as a vasodilator (Pihlanto-Leppälä et al., 1998). The improved ACE inhibitory activity with ripening suggests that sufficiently mature cheese is a good functional food with antihypertensive activity.
Regardless of the differences in ripening time, the ACE inhibition rate increased in all three experimental groups in this study (Table 6). YC showed relatively low ACE-inhibitory activity (47.02%) because it is a raw cheese in the early stages of ripening after production. In contrast, fully aged MC and EC showed very high ACE-inhibitory activities, which was associated with the appearance of various previously analyzed functional peptides. MC showed a high ACE-inhibitory activity of 80.35%, and while further aging did not increase this activity, EC still exhibited a high ACE-inhibitory activity of 75.04%.
| Compound (25 mg) | ACE inhibition rate (%) | |
|---|---|---|
| Average | SEM1) | |
| Captopril (12.5 mg) | 96.01 | 0.44 |
| YC | 47.02 | 0.02 |
| MC | 80.35 | 0.03 |
| EC | 75.04 | 0.05 |
Previous studies on peptides from Cheddar cheese (Ong et al., 2007) reported that the ability to inhibit ACE depends on the degree of protein degradation, with inhibition peaking and then gradually decreasing as a result of extensive protein degradation. The present study showed a similar trend. However, the results revealed that the ACE-inhibitory activity did not significantly decrease after the middle period of ripening (MC) but remained strong even after 3 years (EC).
RAW 264.7 cells were treated with YC, MC, and EC, and the MTS assay was performed to evaluate the survival rate at various concentrations. Concentrations ranged from 500 μg/mL to 50 μg/mL, and each sample was added and incubated for 24 h. Cytotoxicity was assessed by comparing the treated samples with the untreated control cells. Overall, cell activity in the treatment groups was higher than that in the control group, with YC showing the highest cell activity (Fig. 6).
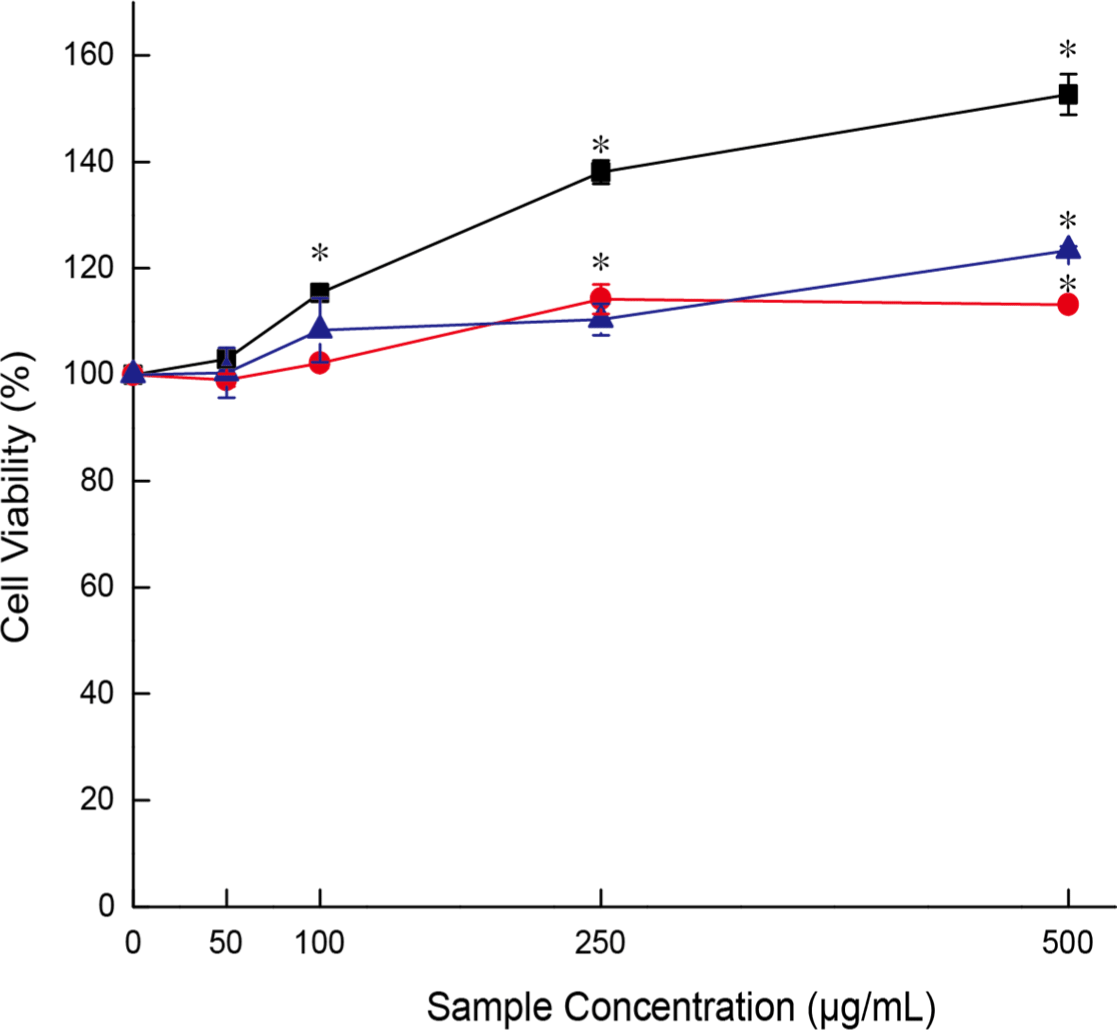
The cell activity under YC treatment was 152.7±3.8% at 500 μg/mL, followed by 138.1±2.2% at 250 μg/mL, 115.3±0.9% at 100 μg/mL, and 102.9±1.5% at 50 μg/mL. However, visual observation of the cells revealed no significant differences from the control cells, indicating that the treatments affected cell activity but not cell number. Therefore, for subsequent experiments, the maximum concentration was set to 100 μg/mL to better assess the effects of YC, MC, and EC on cell activity.
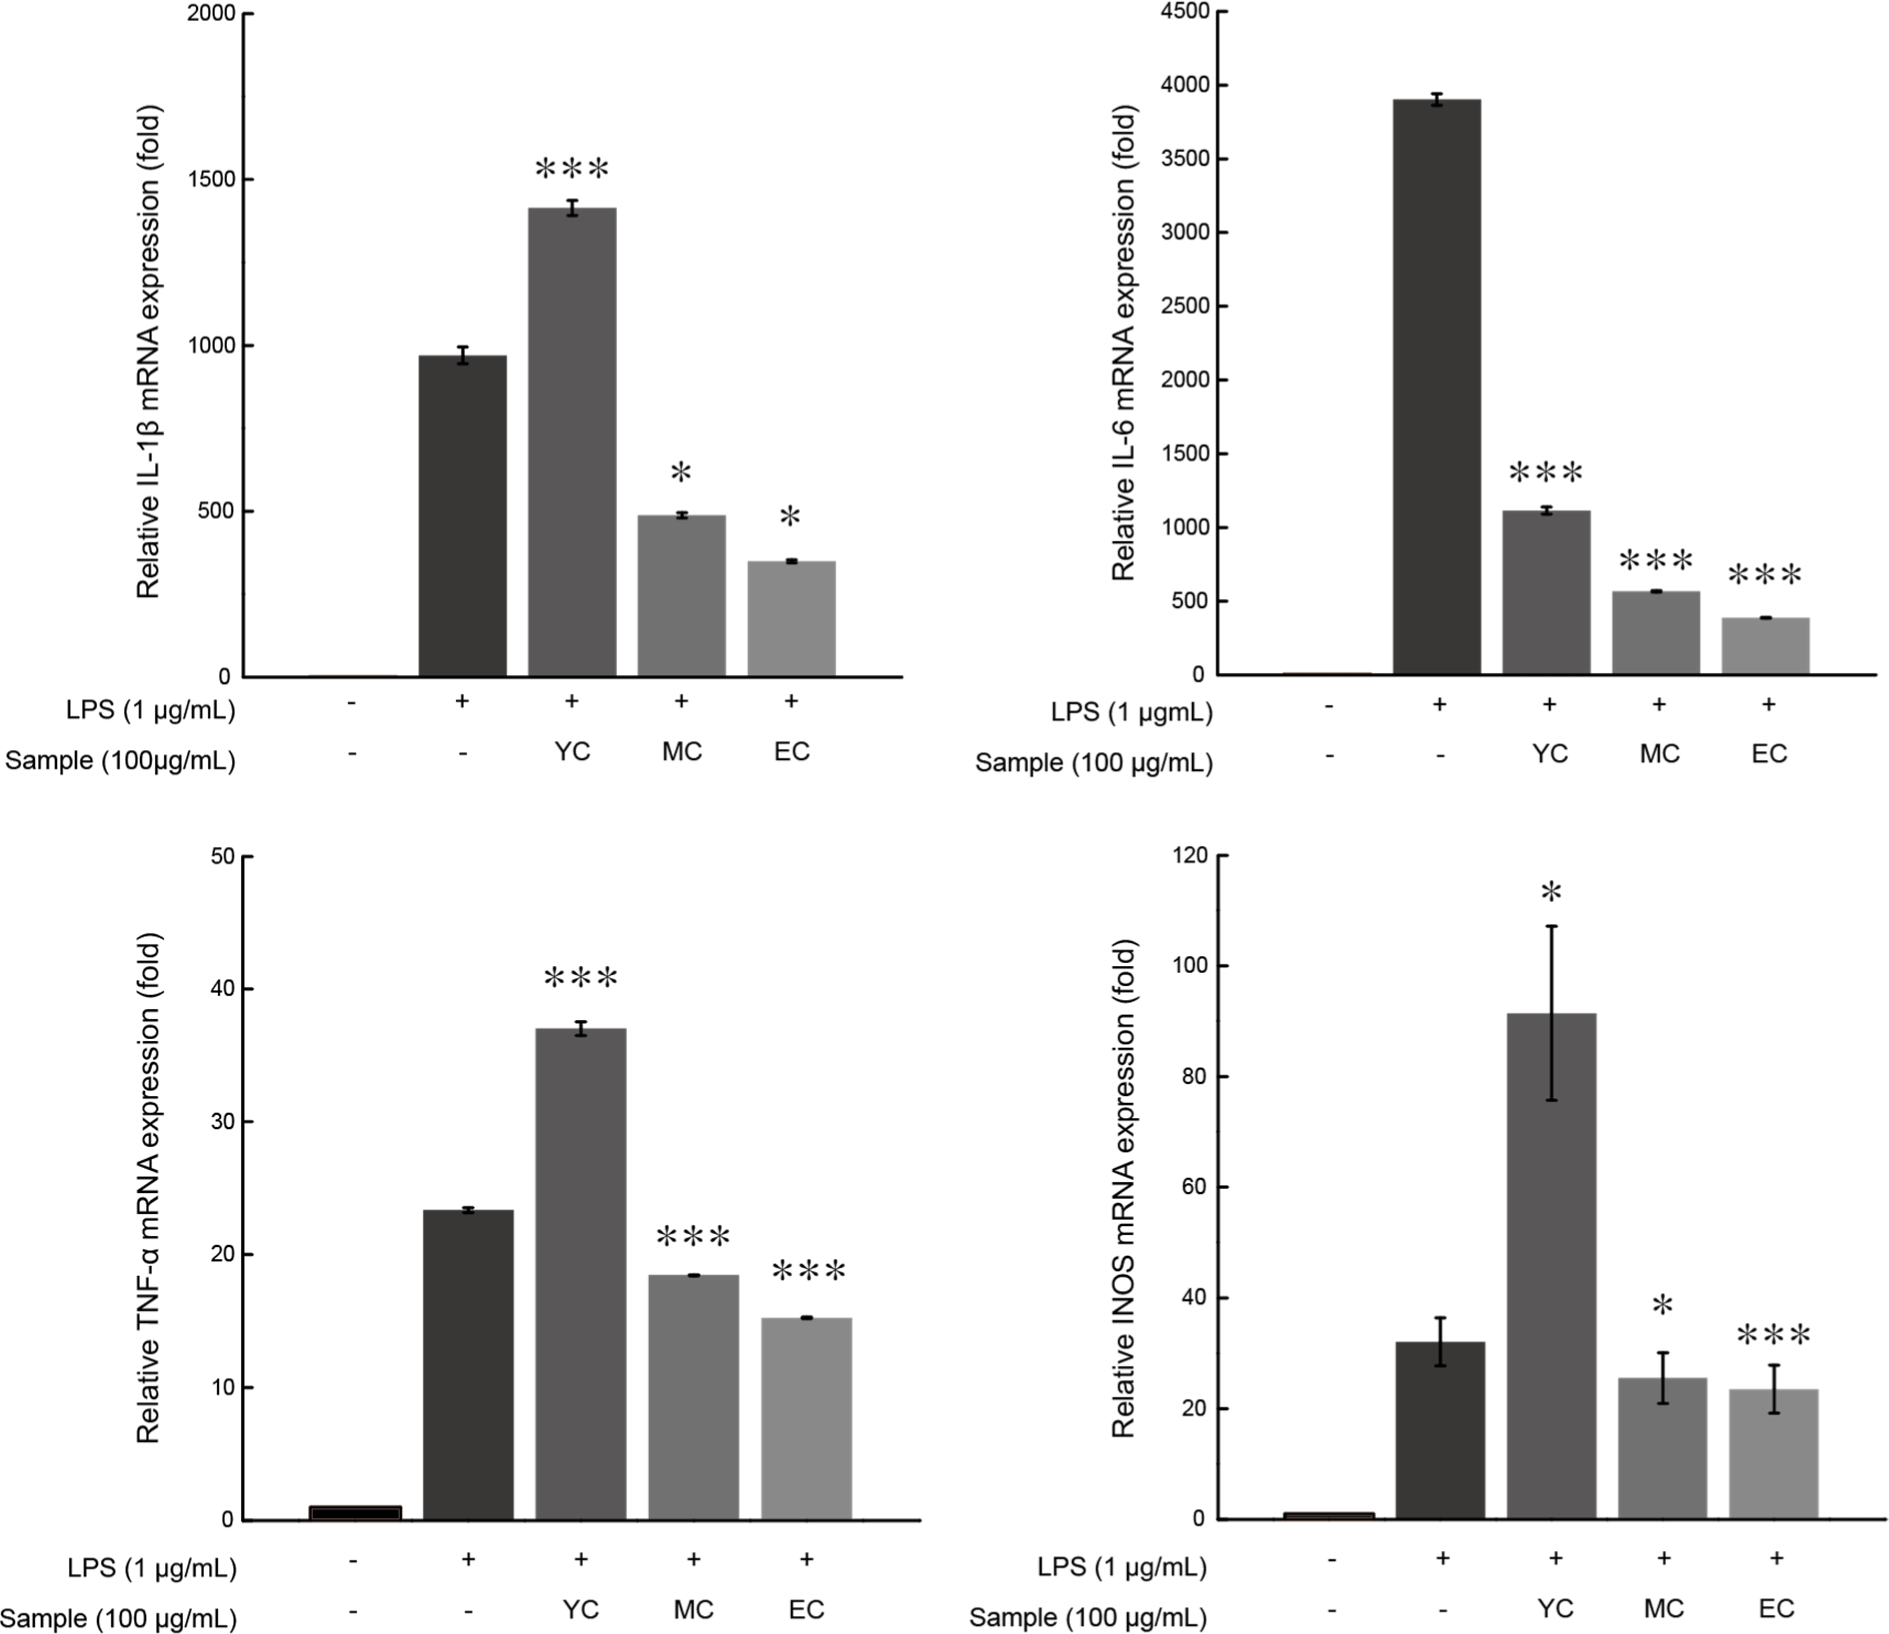
Phosphorylation of IκBα promotes NF-κB signaling, which promotes the expression of pro-inflammatory cytokines like IL-6 and IL-1β and inflammatory cytokines like TNF-α and iNOS (Aderem and Ulevitch, 2000). To evaluate the effect of Cheddar WSE treatment on the inflammatory response induced by LPS in RAW 264.7 cells, mRNA expression levels were calculated.
The expression of inflammatory mRNA tended to decrease with the ripening period (Fig. 7). Specifically, the IL-6 expression level in EC decreased to 9.88%, IL-1β expression to 35.97%, TNF-α expression to 65.29%, and iNOS expression to 72.20%. Consistent with earlier findings in this study, the emergence of anti-inflammatory peptides during Cheddar cheese ripening appears to contribute to the observed anti-inflammatory effects. Accordingly, inflammatory mRNA expression decreased, and the effect became more significant as the ripening period progressed.
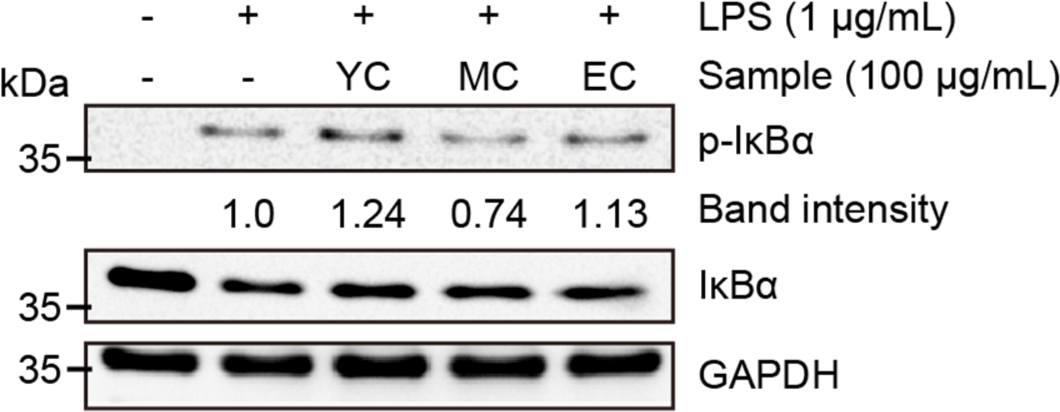
We found that the WSE of sufficiently aged Cheddar effectively inhibited inflammatory signaling in RAW 264.7 cells. Based on these results, it was assumed that Cheddar WSEs would inhibit the phosphorylation levels of IκBα, which induces an inflammatory response. To evaluate the effect of Cheddar WSEs on the inflammatory response, RAW 264.7 cells were treated at a concentration of 100 μg/mL and then treated with LPS to induce an inflammatory response. Next, immunoblot analysis was performed to confirm the effect on the signaling action of NF-κB, which mainly regulates the inflammatory response (Fig. 8). The results revealed that YC treatment induced IκBα phosphorylation 24% more strongly than treatment with LPS alone. In contrast, MC inhibited the IκBα phosphorylation induced by LPS treatment by 74%, indicating a strong anti-inflammatory effect. However, under EC treatment, in contrast to MC, IκBα phosphorylation increased by 13%. From these results, it appears that MC suppressed the inflammatory response of macrophages by inhibiting the phosphorylation of IκBα, but no significant inhibitory activity was observed in EC. Evaluation of the anti-inflammatory activity of Cheddar WSEs showed no anti-inflammatory activity at the beginning of ripening (YC); however, the peptides produced during the ripening process effectively suppressed the inflammatory response. Although this inhibition did not inhibit phosphorylation of IκBα, it showed that an inhibitory effect occurred at the level of inflammatory mRNA expression. The underlying mechanism needs to be elucidated in future studies.
Conclusion
This study was conducted to investigate the changes in peptides and their physiological activities during the long-term aging of cheddar cheese. WSE was prepared for each aging period, and the content of bioactive peptides, antioxidant activity, antihypertensive activity, and anti-inflammatory effects were evaluated. The results show that various peptides present in aged cheddar cheese have excellent antioxidant, anti-inflammatory, and antihypertensive activities, and that long-term aging positively affects these activities. It is presumed that this was influenced not only by previously identified peptides but also by unknown peptides. However, this study did not involve the isolation of peptides or the measurement of their content. Additionally, bioactive peptides that were not discovered could not be confirmed. Therefore, research on the isolation of peptides and their individual activities should be conducted in the future, and biological experiments should be carried out to provide evidence of their practical activities.


