Introduction
Many poultry processing plants currently use disinfectants to control microorganisms after slaughter. In particular, sodium hydrochlorite-based disinfectants have most commonly been used for more than 100 years owing to their low cost and high antibacterial efficacy (Hidalgo et al., 2002; Northcutt and Jones, 2004; Rutala and Weber, 1997; White and Franklin, 1998). However, their disadvantages include the possibility of decreased antibacterial efficacy depending on the environment (Northcutt and Lacy, 2000) and the risk of hypochlorous acid breakdown with decreasing pH of the disinfectant, which can increase the risk of corrosion of equipment and fixtures (European Union, 2017; Korea Health Industry Development Institute, 2003). As presented in Table 1, chlorine-based disinfectants produce toxic chlorine gas when mixed with acids (Fukuzaki, 2006) and react with certain organic substances during the disinfection process to produce the environmental pollutant trihalomethane (Bull et al., 1995; Cantor et al., 1978; King and Marrct, 1996; Morris et al., 1992; Pavón et al., 2008).
Recently, studies have been conducted on disinfectants that can be used safely and effectively as an alternative to chlorine-based disinfectants, with peracetic acid-based disinfectants garnering increasing attention (Kim and Huang, 2020). Peracetic acid (peroxyacetic acid) is a peroxide of acetic acid, produced by making acetic acid react with hydrogen peroxide in the presence of sulfuric acid as a catalyst. At a pH of 5.5–8.2, spontaneous decomposition occurs, primarily by acetic acid and oxygen (Block, 2001; Gehr and Cochrane, 2002), wherein acetic acid, hydrogen peroxide, oxygen, and water are produced as decomposition products (Gehr and Cochrane, 2002; Lefevre et al., 1992; Wagner et al., 2002).
Peracetic acid is a colorless liquid with a pungent vinegar-like odor that is known for its antibacterial properties against a wide range of microorganisms (Kim and Kim, 2015; U.S. Environmental Protection Agency, 2012; Zhang et al., 2022). In the United States (US), it was approved by the US Food and Drug Administration in 1986 for use as a disinfectant solution and subsequently approved by the US Environmental Protection Agency (EPA) and US Department of Agriculture. It is currently used in a variety of industries, including food, medicine, agriculture, alcoholic beverages, institutional horticulture facilities and equipment, animal housing, the dairy industry, and water treatment (Baldry, 1983; Block, 2001; Dychdala, 1988; Kitis, 2004; Luukkonen and Pehkonen, 2017). However, to date, domestic research on the use and appropriate concentration of peracetic acid-based disinfectants in poultry processing plants is limited.
In this study, we examined the antibacterial efficacy of peracetic acid as a replacement for chlorine-based disinfectants currently used in poultry processing plants; investigated the effect of peracetic acid disinfectant on the appearance of chicken meat by evaluating the quality of chicken meat using an electronic tongue and electronic nose, and established the optimal concentration and safe-use level to meet the food hygiene safety requirements of chicken meat. Among peracetic acid-based disinfectants, there is no difference in the components of samples peracetic acid A and B used in this experiment, but it is thought that applying a small mixture of octane compared to general peracetic acid will protect the chicken’s appearance from discoloration compared to peracetic acid and increase the product satisfaction of final consumers. This is expected to minimize the spoiled appearance of chicken meat that can occur when using peracetic acid-based disinfectants and improve end-user product satisfaction by preventing industrial hazards, thereby increasing its usability and profitability in the poultry industry.
Materials and Methods
The experimental chickens were Arbor Acres Plus breed and sampled from the Cherrybro poultry processing plant. The contaminated water used for disinfection and verification of sterilization was mixed with 5 kg of meat and 15 L of water and stored in an incubator at 30°C for 48 h. The deteriorated contaminated water was filtered through a mesh net. Peracetic acid was used from Daesung (Seoul, Korea; Oxyacid) as present in Table 2, and the peracetic acid sample was a mixture of peracetic acid, peroxyoctanoic acid, hydrogen peroxide, acetic acid, and octanoic acid, as presented in Table 3. The composition of peracetic acid A and B for the treatment groups was the same. For comparison, 13%–15% of commercially available sodium hypochlorite was used.
| Classification | Peracetic acid A (%) | Peracetic acid B (%) |
|---|---|---|
| POAA+POOA | 16 | 17.30 |
| H2O2 | 5.50 | 5.00 |
| Acetic acid | 47.50 | 49.00 |
| Octanoic acid | 1.0–4.0 | 1.0–4.0 |
The disinfectants used in the experiments were prepared, as presented in Tables 4 and 5, and their concentrations were determined by reading the test paper on a dedicated instrument. The tap water used in the experiment was 10 to 15 degrees of water at pH 6 to 7, and the residual chlorine present in the tap water was considered to have no effect on the experimental results. The concentration of each disinfectant was based on the commonly used product (40%–60% acetic acid, 15%–20% peracetic+peroxyoctanoic acid, 2.5%–10% hydrogen peroxide).
| Concentration (ppm) | Tab water (L)1) | Peracetic acid (g; Daesung, A, and B) |
|---|---|---|
| 50 | 60 | 19.8 |
| 100 | 60 | 39.6 |
| 150 | 60 | 59.4 |
| 200 | 60 | 79.2 |
| Concentration (ppm) | Tab water (L)1) | 12% Sodium hypochlorite (g) |
|---|---|---|
| 50 | 60 | 45 |
| 100 | 60 | 90 |
| 150 | 60 | 165 |
| 200 | 60 | 180 |
At each concentration of the four disinfectants, 21 carcasses were immersed for 5 min (based on the time required to pass through the combination chiller during the conventional poultry processing process) and subsequently placed in a refrigerator below 5°C for 1 h (based on the time required to pass through the air chiller for 1 h during the conventional poultry processing process), and the test was conducted according to the bacteriological test method for meat according to the Food Code.
We collected contaminated water 12 times (10 mL each) to be used as raw samples. The experimental samples were prepared by creating 321 samples of 9 mL of raw contaminated water samples and dispensing 1 mL of each concentration in four disinfectants [peracetic acid (Daesung), peracetic acid A, peracetic acid B, and sodium hypochlorite], diluting them with a vortex mix for 30 s, and subsequently vortexing for 30 min.
For Salmonella, 22.5 mL of raw contaminated water sample was prepared, treated with four disinfectants (peracetic acid, peracetic acid A, peracetic acid B, and sodium hypochlorite) at 50, 100, 150, and 200 ppm each in a 2.5-mL aliquot (applied by 10%), diluted with a vortex mixer for 30 s, and stabilized for 30 min prior to use.
For the general bacterial count experiment, the experimental solution was re-homogenized with a vortex mixer, and the samples were taken in 1 mL aliquots with a micropipette and diluted in 9 mL of 0.85% sterile PBS to concentrations of 104, 105, and 106 subsequently, they were incubated in a general dry-film medium to measure the bacterial count. The resulting red colonies were counted and multiplied by the dilution factor to determine the general bacterial count. The reduction rate (%) calculated dividing (Initial bacterial count – Count of bacteria after 10 min) by initial bacterial count and multiplying 100.
For the count experiment of Escherichia coli, the dilutions prepared the same way as those for the general bacterial count experiment were incubated on E. coli dry-film medium, and the bubbles formed around the colonies after incubation were counted and multiplied by the dilution factor to determine the E. coli count. The Salmonella test was conducted by adding sterilized buffered peptone water to the prepared test solution for primary growth, and the culture was harvested and sub-cultured in Rappaport-Vassiliadis medium for secondary growth. The cultures from the second round of growth were then sub-cultured onto xylose lysine deoxycholate (XLD) agar and Brilliant Green (BG) Sulfa Agar, with XLD agar and BG Sulfa Agar being considered positive when black and red colonies occurred, respectively, and the test was finally confirmed to be positive when all media showed positive results. The reduction rate (%) calculated dividing (Initial bacterial count – Count of bacteria after 10 min) by initial bacterial count and multiplying 100.
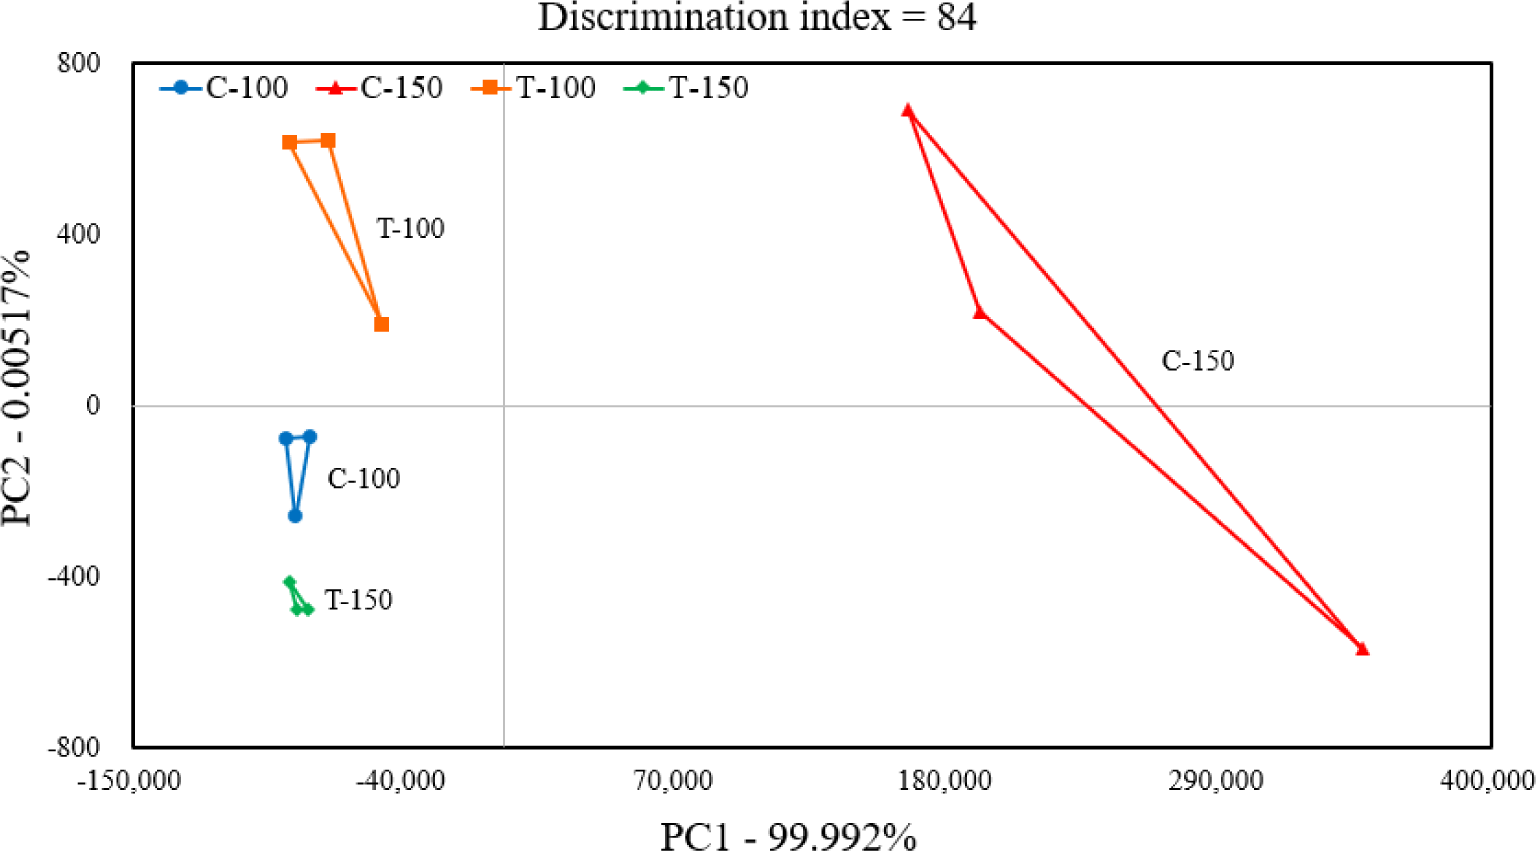
Heracles II Electronic Nose (Alpha MOS, Toulouse, France) was used to analyze the flavor components of the samples, and the measurement results were expressed as the rate of change of the resistance value of the volatile components (Rgas) of the samples with respect to the resistance value of air (Rair) using Alpha Soft software (Alpha MOS) for flavor principal component analysis (PCA); the sensitivity of each sensor was expressed as delta (Rgas/Rair). The measured flavor components were represented in a PCA plot, and the first (PC1) and second principal component (PC2) values were obtained to distinguish the flavor patterns. For comparison of peracetic acid and sodium hypochlorite acid, set peracetic A as control and sodium hypochlorite acid as treatment (C-100=peracetic A 100 ppm; C-150=peracetic A 150 ppm; T-100=sodium hypochlorite acid 100 ppm; T-150=sodium hypochlorite acid 150 ppm).
All experiments were conducted with at least three replicates and the results were expressed as the mean and SD. Statistical analysis was conducted using Minitab 18 (Minitab, State College, PA, USA). One-way analysis of variance (ANOVA) was used to test the significance (p<0.05) of each sample, and Tukey’s multiple range test was used for the post-hoc test.
Results and Discussion
Table 6 indicates the antibacterial efficacy of peracetic acid (Daesung) on carcasses and contaminated water. The reduction of general bacteria in the carcasses was not significantly different at 50, 100, and 150 ppm but tended to be the lowest (60.2%) at 100 ppm. At 200 ppm, the bacterial count significantly reduced from 5,350 before treatment to 388.5 after treatment (p<0.05). For E. coli, no significant differences were observed, with reduction rates of 63.8% and 66.7% at 50 and 100 ppm, respectively, but E. coli decreased significantly by 71.3% and 89.3% at 150 and at 200 ppm, respectively (p<0.05). When applied to contaminated water, the highest and lowest decreases in the number of general bacteria were 63.5% and 46.5% at 200 and 50 ppm, respectively (p<0.05). Similar to general bacteria, E. coli showed the highest reduction at 200 ppm, with an 82.4% reduction from 3.6×10⁷ to 6.3×10⁶, but significance was not identified.
Table 7 indicates the antibacterial efficacy of peracetic acid A on carcasses and contaminated water. When applied to carcasses, the largest decrease in the number of general bacteria in contaminated water was 98.4% at 200 ppm, whereas the reduction rate was significantly lower (88.8%) at 50 ppm (p<0.05), showing no significant differences at other concentrations. For E. coli, no significant difference was observed at all concentrations, but the lowest reduction rate was 91.6% at 50 ppm, and the antibacterial efficacy tended to increase in a concentration-dependent manner. When applied to contaminated water, general bacteria decreased by 58.6% at 50 ppm, 64.3% at 100 ppm, and 72.8% at 150 and 200 ppm, showing a significantly higher antibacterial efficacy (p<0.05). For E. coli, the antibacterial efficacy was the highest at 200 ppm, with a reduction in the count of E. coli from 3.6×10⁷ to 2.7×10⁶ (p<0.05), followed by those at 100 (88.0%) and 150 ppm (84.0%), with no significant difference between them; 50 ppm of peracetic acid A showed the lowest reduction rate, namely, 79.1% (p<0.05).
Table 8 shows the antibacterial efficacy of peracetic acid B on carcasses and contaminated water. When applied to carcasses, the reduction in general bacteria was lowest at 50 ppm, with no significant difference from that at 100 ppm. The highest reduction was observed at 200 ppm, with a significant reduction of 92.5% (p<0.05). For E. coli, the largest reduction was 92.2% at 200 ppm (p<0.05), followed by 85.0% at 150 ppm, and no significant reduction at 100 and 50 ppm. When applied to contaminated water, the bacterial reduction was higher in general bacteria with increasing disinfectant concentration, but no significant difference was observed between them. For E. coli, the largest reduction was 82.9% at 200 ppm, and the reduction rate was significantly lower (61.4%) at 50 ppm (p<0.05), with no significant difference between concentration of 100 and 150 ppm.
Table 9 shows the antibacterial efficacy of sodium hypochlorite on carcasses and contaminated water. When applied to carcasses, the antibacterial efficacy was significantly higher at 200 ppm (78.3%; p<0.05), followed by those at 150 and 100 ppm; it then decreased to 47.3% at 50 ppm. For E. coli, the largest reduction was found at 200 ppm (p<0.05), and the antibacterial efficacy decreased in a concentration-dependent manner, but no significant difference was observed among them. When applied to contaminated water, the largest decrease in the number of general bacteria was 56.3% at 200 ppm, and the lowest reduction rates were 29.4% and 35.0% at 50 and 100 ppm, respectively (p<0.05). The reduction rates for E. coli were 56.3%, 48.3%, 35.0%, and 29.4% at 200, 150, 100, and 50 ppm, respectively, with no significant differences between those at each concentration.
Referred to results of Tables 6, 7, 8, and 9, based on the results in section 200 ppm was set as the optimal concentration for each disinfectant in this study. The comparison of the antibacterial efficacy of each disinfectant at the optimal (200 ppm) concentration is presented in Table 10. Before applying disinfectant to treatment, all treatment have no statistically significance in result of antibacterial efficacy. All disinfectants except sodium hypochlorite showed a bacterial reduction rate of 90% when applied to carcasses (p<0.05). In particular, when applied to carcasses, peracetic acid A showed a significant reduction of 99.4% in E. coli levels from 6,941.7 before treatment to 44.2 after treatment compared with that in the control (p<0.05). When applied to contaminated water, peracetic acid A showed the highest significant reduction among all disinfectants, with a reduction rate of approximately 80% (p<0.05). However, no significant difference was observed in antibacterial efficacy between peracetic acid (Daesung) and peracetic acid B. The average reduction from the control was the highest for peracetic acid A, peracetic acid B, peracetic acid (Daesung), and sodium hypochlorite, with sodium hypochlorite showing the lowest reduction among all disinfectants, regardless of concentration (p<0.05).
The tests of antibacterial efficacy on sample carcasses revealed that the peracetic acid series had higher antibacterial efficacy than sodium hypochlorite at the same concentration. This result is consistent with the trends observed in other previous studies (Kim et al., 2010; Lee, 2020; Lee et al., 2006). Considering the peracetic acid series, peracetic acid A showed an antibacterial efficacy of more than 90% at 50 ppm and a reduction rate consistently exceeding 90% at other concentrations, which are considered to be the highest among all disinfectants (p<0.05).
The antibacterial efficacy tests on contaminated water revealed that the peracetic acid-based disinfectants had a significantly higher reduction rate than sodium hypochlorite at the same concentration (p<0.05). When comparing peracetic acid-based disinfectants, peracetic acid A had the highest reduction rate at all concentrations, distinguishing it from the other disinfectants (p<0.05), whereas peracetic acid B and peracetic acid (Daesung) had similar effects.
The changes in the appearance of chicken are shown in Figs. 1, 2, 3, and 4. Discoloration was observed on the neck and tips with peracetic acid and peracetic acid A at 100 ppm and peracetic acid B at 150 ppm, whereas no discoloration was observed with sodium hypochlorite at any concentration.
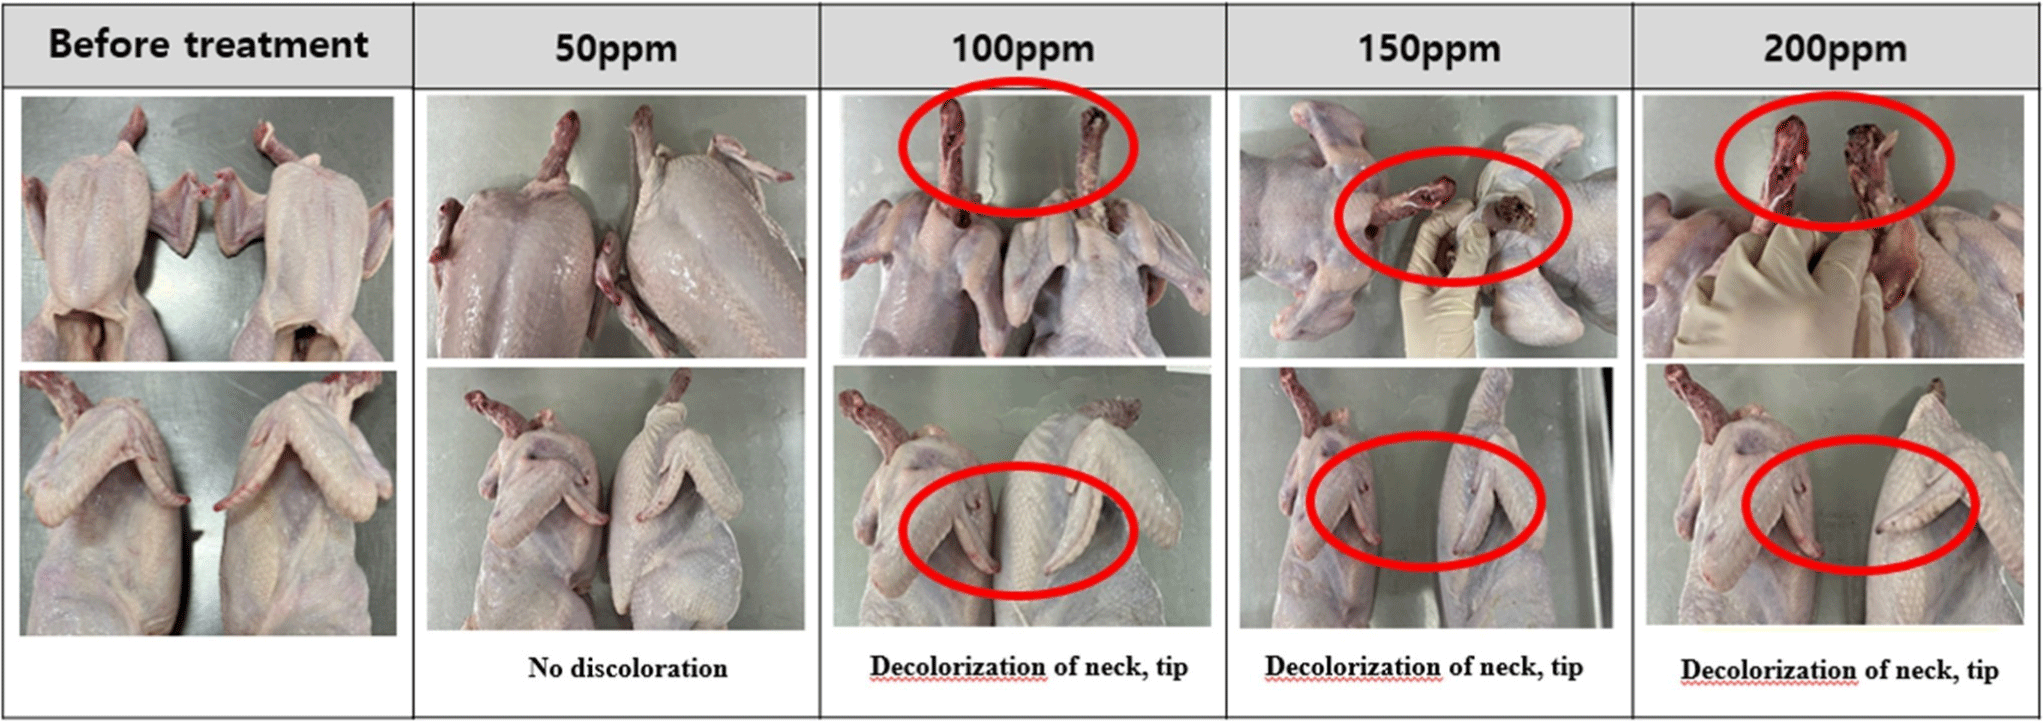
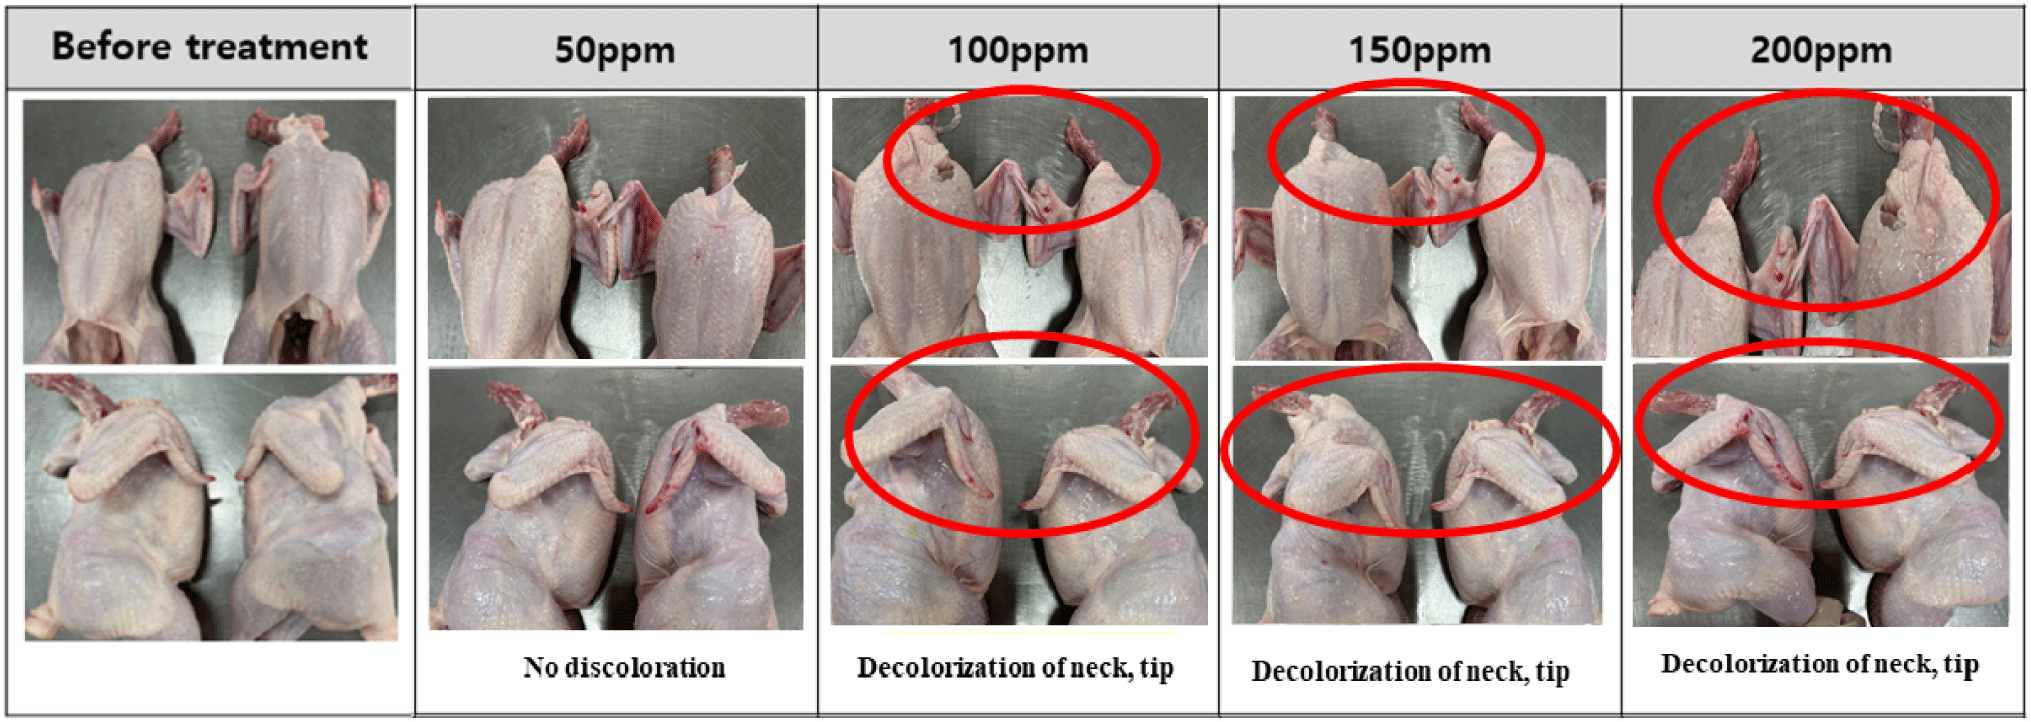
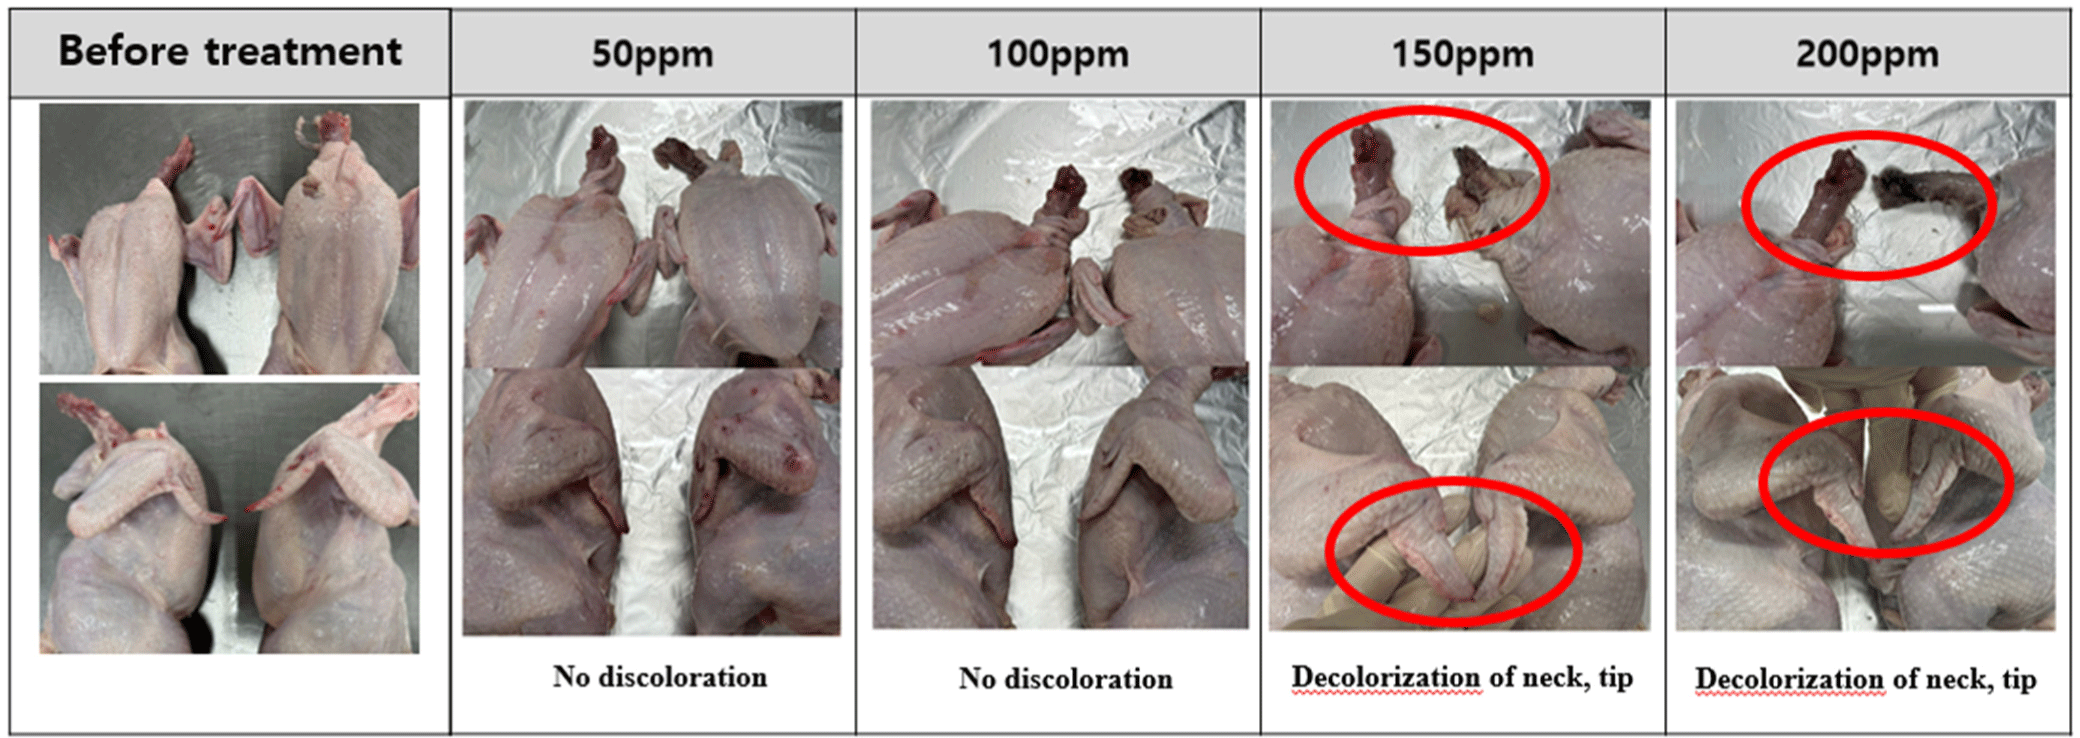
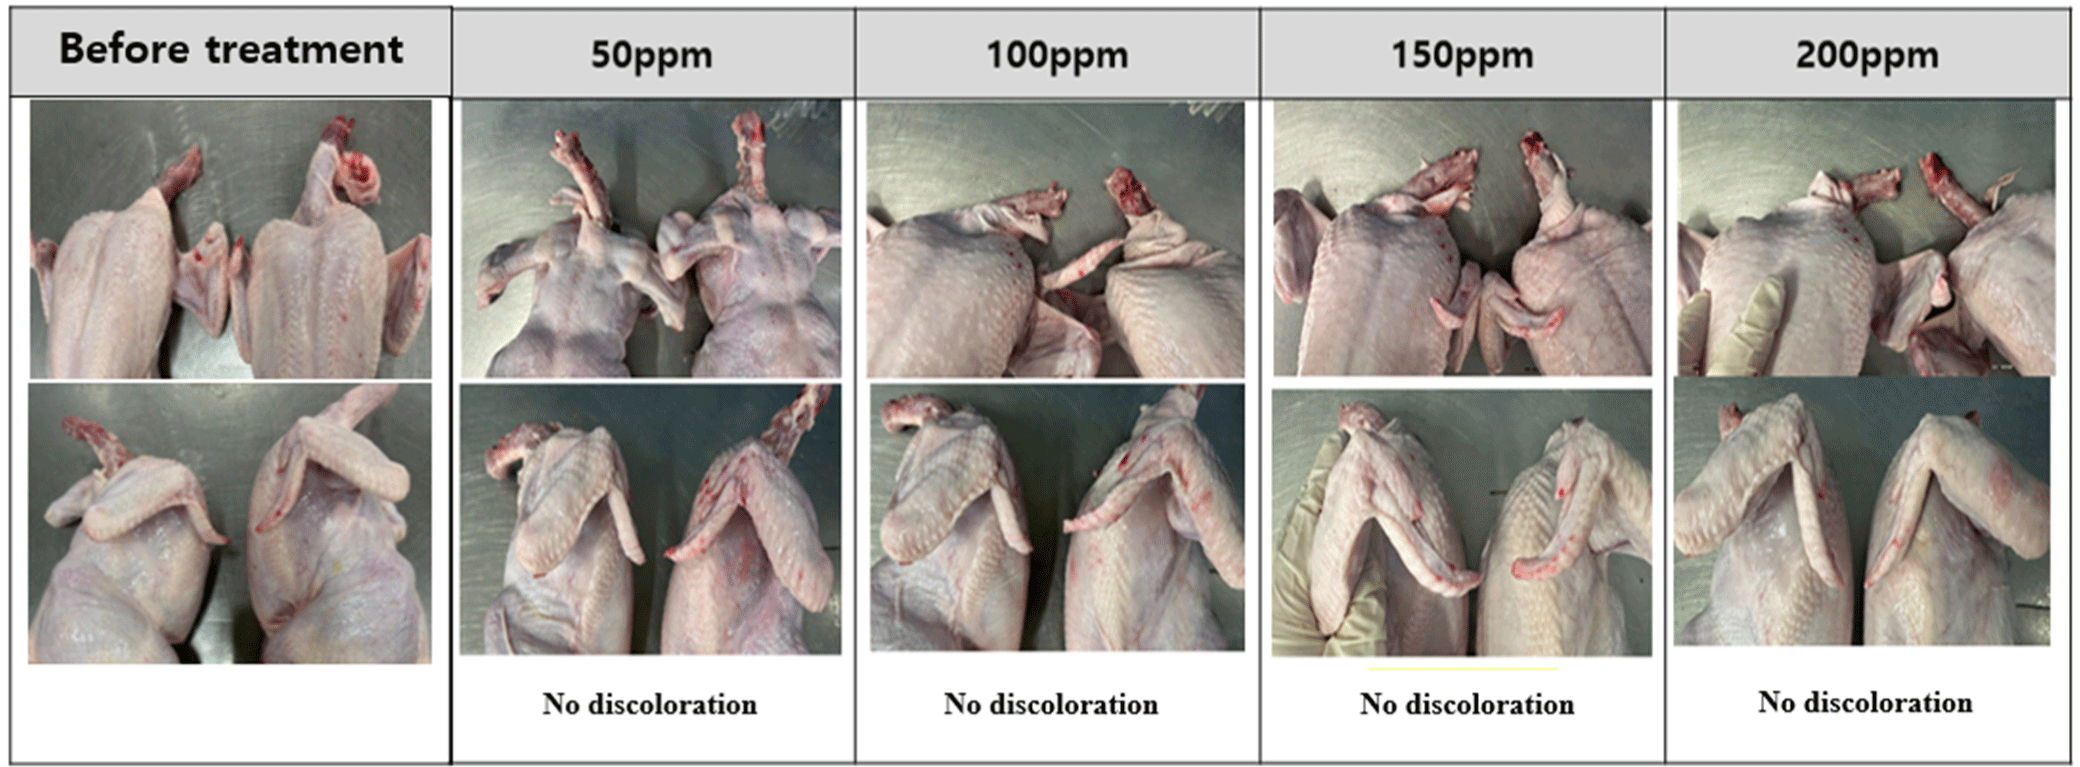
Meat color are subjective characteristic of meat and consumers tend to favor chicken meat that closely resembles the color of the meat they typically consume (Manjankattil et al., 2021). Various organic acids have been studied for application in poultry processing plant including acetic, citric, and lactic acid (Dickens et al., 1994; Mulder et al., 1987). It has been reported that these acids, while effective as antimicrobials, may result in negative flavor and color alterations (Blankenship et al., 1990). In current experiment, discoloration was observed on the neck and tips with peracetic acid and peracetic acid A at 100 ppm and peracetic acid B at 150 ppm. However, no discoloration was observed with sodium hypochlorite at any concentration. These results were different from with Bauermeister et al. (2008), as there were no differences in the CIE L* values of the 0.01% and 0.015% peracetic acid levels and sodium hypochlorite. The reason for these inconsistent results in appearances may be due to the different analysis methods of meat color. In our experiment, we simply analyze changes in appearances, therefore, a precise analysis method is needed for further study such as Hunter L*, a*, b* color system.
Salmonella was not detected in all samples at each concentration, as presented in Table 11.
Fig. 5 shows the PCA results of the electronic nose. In the PCA section of the sample, the values of PC1 and PC2 were 99.992 and 0.005517%, respectively, and the differences between treatments were mainly distinguished by PC1. Along the x-axis, C-100, T-100, and T-150 did not show a significant change in position among treatment groups, with C-150 being the furthest to the right and clearly distinguishable from the other treatment groups. C-100, T-100, and T-150 seemed to exhibit similar flavors, whereas C-150 exhibited a different flavor profile from the other treatment groups. Therefore, the olfactory characteristics after disinfection with sodium hypochlorite at 100 or 150 ppm is expected to be similar to those after disinfection with peracetic acid A at 100 ppm.
Conclusion
In this study, we evaluated the antibacterial efficacy of three peracetic acid-based disinfectants and a sodium hypochlorite disinfectant applied to carcasses and contaminated water to determine the effect of peracetic acid on chicken meat. In the results of antibacterial efficacy tests, peracetic acid-based disinfectants had a significantly higher reduction rate than sodium hypochlorite. Increasing concentration of peracetic A had higher reduction rate than others at the same concentration. However, discoloration was observed on the neck and tips with peracetic acid A at 100 to 200. In conclusion, considering both reduction rate of bacteria and appearance, 50 ppm of peracetic acid A was adequate for use in poultry processing plants.


