ARTICLE

Comparative Evaluation of the Nutrient Composition and Lipidomic Profile of Different Parts of Muscle in the Chaka Sheep

Xianli Xu1,2https://orcid.org/0000-0002-5197-0299, Tongqing Guo1,2https://orcid.org/0000-0003-3876-325X, Qian Zhang1https://orcid.org/0009-0002-5554-7516, Hongjin Liu1https://orcid.org/0000-0001-5625-2395, Xungang Wang1https://orcid.org/0000-0001-8593-7844, Na Li1,2https://orcid.org/0009-0002-8642-8480, Yalin Wang1,2https://orcid.org/0009-0007-0914-4157, Lin Wei1,2https://orcid.org/0000-0003-1256-3698, Linyong Hu1,*https://orcid.org/0000-0002-6149-4636, Shixiao Xu1,*https://orcid.org/0000-0003-4100-7017
Author Information & Copyright
1Northwest Institute of Plateau Biology, Chinese Academy of Sciences, Xining 810008, China
2University of Chinese Academy of Sciences, Beijing 100049, China
*Corresponding author : Linyong Hu, Northwest Institute of Plateau Biology, Chinese Academy of Sciences, Xining 810008, China, Tel: +86-18397080068, Fax: +86-0971-6143282, E-mail: lyhu@nwipb.cas.cn
*Corresponding author : Shixiao Xu, Northwest Institute of Plateau Biology, Chinese Academy of Sciences, Xining 810008, China, Tel: +86-13369766778, Fax: +86-0971-6143282, E-mail: ucasxianlixu@163.com

© Korean Society for Food Science of Animal Resources. This is an Open-Access article distributed under the terms of the Creative Commons Attribution Non-Commercial License (http://creativecommons.org/licenses/by-nc/3.0) which permits unrestricted non-commercial use, distribution, and reproduction in any medium, provided the original work is properly cited.

Received: May 05, 2024 ; Revised: Jun 06, 2024 ; Accepted: Jun 14, 2024

Published Online: Nov 01, 2024

Abstract

Mutton is one of the most popular meats among the public due to its high nutritional value. In this study, we compared and analyzed the nutritional composition and volatile flavor substances in longissimus dorsi (LD), psoas major (PM), and biceps femoris (BF) of the Chaka sheep, and then analyzed the lipid composition using the technique of UHPLC-Q-Exactive Orbitrap MS/MS. Our results indicated that the LD had the highest crude protein content (22.63%), the highest levels of aspartic acid (5.72%) and histidine (2.76%), the BF had the highest contents of glycine (3.40%) and proline (2.88%), the PM had the highest abundance of ω-6 polyunsaturated fatty acids (7.06%), linoleic acid (C18:2n6c; 5.03%), and volatile flavor compounds (alcohols, ketones, and esters). Moreover, our study detected 2,639 lipid molecules classified into 42 classes, among which phospholipids were the major lipids, accounting for nearly half of the total lipids. Among them, phosphatidylethanolamine (PE; 18:2/18:2) and phosphatidylcholine (PC; 25:0/11:3) were the characteristic lipids in LD. Phosphatidylserine (PS; 20:3e/20:4), lysophosphatidylcholine (LPC; 18:3), PE (8:1e/12:3), triacylglycerol (TG; 18:0e/16:0/18:1), TG (18:0/18:0/18:0), TG (18:0e/18:0/18:1), and TG (18:0e/18:1/18:1) were marker lipids in PM. LPC (16:0), LPC (18:1), lysophosphatidylethanolamine (18:1), PC (15:0/22:6), PE (18:1/18:1), Hex1Cer (d24:1/18:1), and PC (10:0e/6:0) were representative lipids in BF. Intermolecular correlations between PC, PE, Hex1Cer, PS, TG, diacylglycerol, and cardiolipid were revealed by correlation analysis. In conclusion, this study provided the interpretation of the specific nutritional indicators and lipid profile in the tripartite muscle of Chaka sheep, which can be used as a guidance for future research on the nutritional qualities and economic benefits of mutton.

Keywords: Chaka sheep; amino acids; fatty acids; volatile flavors; lipids profiles

Introduction

Mutton is gradually becoming a superior substitute for the domestic market, as it is a good source of essential nutrients, high in protein and low in fat (Ramos et al., 2021). In the last few years, the consumption of high quality mutton products has risen dramatically. Chaka sheep as Qinghai Plateau wool and meat with semi-fine wool sheep is a breed of Tibetan sheep, which grows in the area of Chaka Salt Lake in Wulan County, is a cultivar of Chaka sheep (Chen et al., 2019a). In 1971, Wulan County introduced the British and New Zealand Romney-Marsh long-wool type of breeding sheep from Hudong Original Breeding Field of Qinghai Province and Daliuliu Original Breeding Field of Anhui Province to be cross-bred (Chen et al., 2019b). As the breed was improved and bred in the Chaka area, it was named “Chaka sheep”, which has been granted the protection of the Registration of Geographical Indications for agricultural products (Guo et al., 2022). Studies have shown that there are some differences in the nutritional composition, sensory quality, and processing quality of different parts of the muscle (Mohanty et al., 2010). Different parts of muscle have unique collagen content, structure, and properties (Zuo et al., 2016). Kohn et al. (2023) found significant differences in muscle fiber types and metabolic profiles in different parts of African black ostrich muscles.

Lipids, an important nutritional component in lamb, are critical biological small molecules that act as components of cell membranes, signal transduction, energy sources, and signaling pathway intermediates (Lugo Charriez et al., 2021). The lipid profile of meat is influenced by many factors, one of which is the type of muscle (Boselli et al., 2008). The lipid composition of tissues varies in different parts of the body (Yin et al., 2023). Li et al. (2022a) identified seventy-nine of 842 lipids in different muscles of Hu lambs. The content and type of lipids vary significantly in different meat products, and potential markers of lipids have gradually become one of the methods to analyze the quality and type of meat products. However, studies on the lipid profile and characteristics of different parts of the muscles of Chaka sheep are still incomplete. Thus, the lipidomic profile and its components of Chaka sheep need to be elucidated.

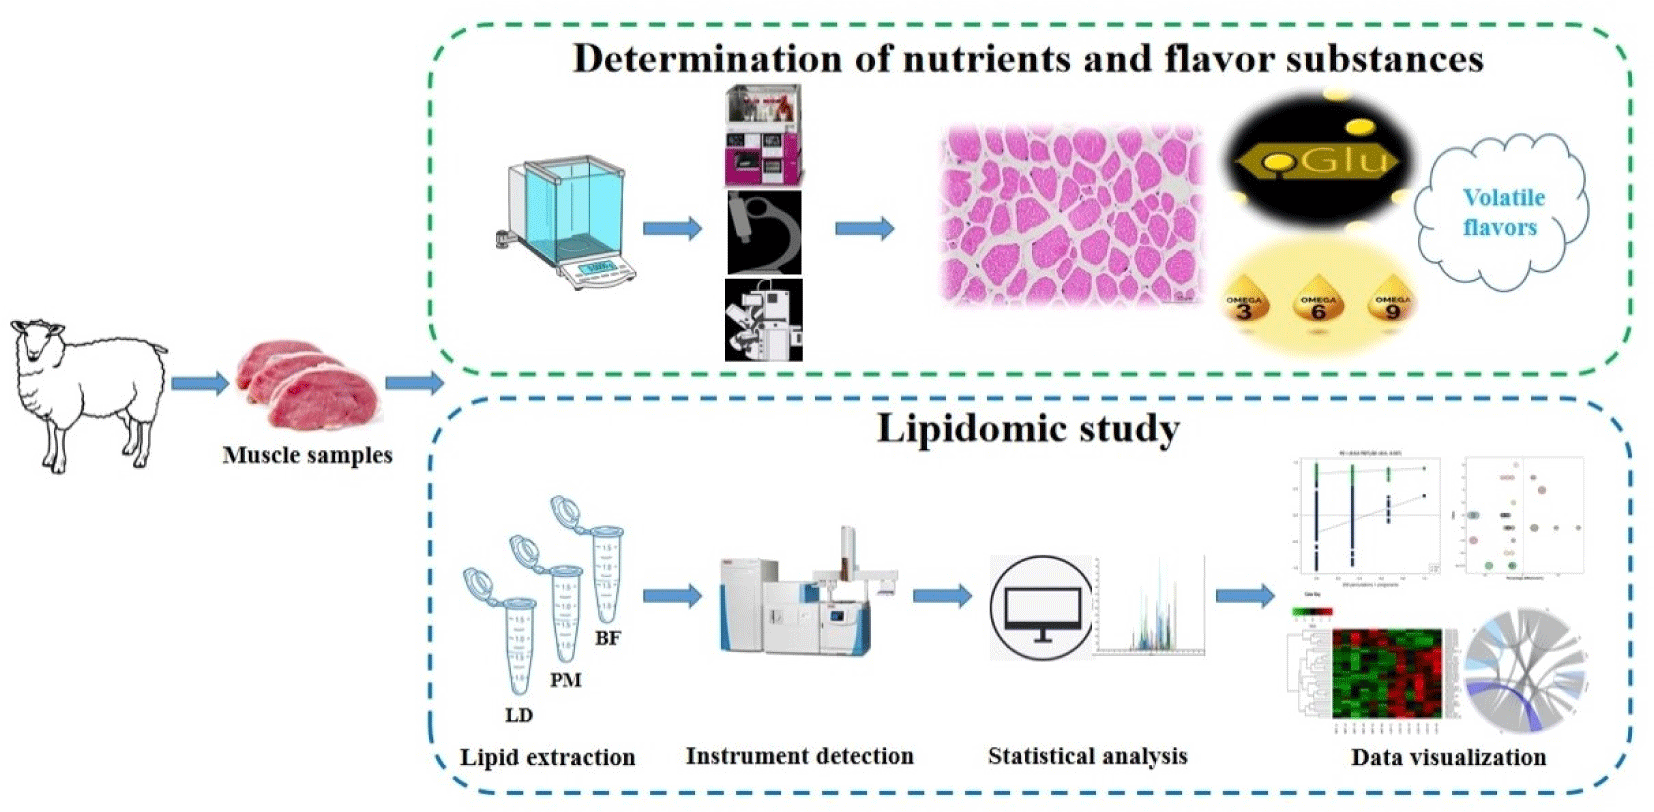
Therefore, this study determined and analyzed the nutrient composition, lipid content, and differential lipid molecules in the longissimus dorsi (LD), psoas major (PM), and biceps femoris (BF) of the Chaka sheep (Fig. 1). The aims of this research are to define the basic data about the composition and nutritional quality of three different muscles of the Chaka sheep and to provide insight into the utilization of lipidomics in the animal products industry.

kosfa-44-6-1305-g1
Fig. 1. Experimental and analytical processes followed in this study.
Download Original Figure

Materials and Methods

Sample collection

The samples were obtained from Jintai Ranch, Chaka Town, Wulan County, Haixi Mongolian and Tibetan Autonomous Prefecture, Qinghai Province, China. We selected nine experimental sheep, all 1 year old, weighing about 45 kg, female. They were identified by experts as Chaka sheep. The Chaka sheep were manually slaughtered by puncturing the occipital atlantoaxial joint of the sheep with a sharp knife, severing the spinal nerves, then cutting the carotid artery to bleed out the blood, and then skinning the sheep, and after removing the head and hooves, 9 replicates each of LD (muscles of the back of the sheep between the 9th and 11th ribs), BF, and PM were collected. The LD, PM and BF of Chaka sheep were cut and packed into lyophilized vessels and then immediately stored in liquid nitrogen for lipidomic study, and the remaining meat samples were wrapped in cling film and placed in a thermal box and returned to the laboratory for nutrient analysis. Three replicates were set up for nutritional quality determination and six replicates for lipidomics.

Determination of the chemical components and characterization of the muscle fibers

An OPTO-LAB meat color analyzer (Konica Minolta, Tokyo, Japan) was employed to measure the color of the muscle. A PH-STAR carcass muscle pH direct tester (MATTHAUS, Portmeuse, Germany) was utilized for pH measurement of all samples. Crude protein (CP), total ash (Ash), ether extract (EE), and moisture content (MSTR) were measured according to Cohen’s methods (Cohen, 1971).

Conventional hematoxylin and eosin (H&E) staining was used to measure muscle fiber characteristics. Samples were scanned using a Leica RM-235 slide scanner (Leica, Nussloch, Germany) and the images were acquired by using CaseViewer 6.0 software (3D-Histech, Budapest, Hungary; Xu et al., 2023).

Determination of amino acids and fatty acids

A Sykam S-433D amino acid analyzer (Sykam, Munich, Germany) was used for amino acid determination. After weighing 50 mg of dry meat powder from a single sample and hydrolysis with hydrochloric acid solution (36% hydrochloric acid: water=1:1, v/v) for 24 h, 2 mL of the diluted specimens were transferred to the vial condenser. 10 mL of sample diluents were poured in and stirred. The compounded sample was withdrawn with a hypodermic syringe, filtered using a needle filter, and injected into the vial to assay (Ma et al., 2021).

The fatty acids were determined by gas chromatography-mass spectrometry (GC-MS). 5 g of the sample was taken, drawn and filtered into the injection vial with a stirred syringe. After adding 8 mL of a sodium hydroxide-methanol solution at 20 g/L relative density, a condensor for fat degradation and fatty acid methyl esterification was attached, n-heptane was poured in, shaken for 2.5 min, and a sodium chloride aqueous buffer solution was poured in. Supernatant was collected, a volume of sodium sulfate hydroxide was added, stirred thoroughly, and supernatant was transferred to vials for automated analysis (Schiavon et al., 2016).

Determination of volatile flavor compounds

The combined technology of solid phase microextraction (SPME) and GC-MS was applied to determine the volatile aroma compounds. The muscle was minced and ground, 4 g meat was added to a 20 mL headspace bottle, 20% NaCl solution and 5 μL of 2-methyl-3-heptanone solution was mixed, stirred thoroughly, and water bath (85°C) for 55 min, then chilled to 55°C. The SPME fiber probe was inserted into the GC-MS injector connection, and the adsorber head was in place for extraction for 40 min. The SPME fiber probe was inserted into the GC-MS injector connection, and the adsorber head was in place during extraction for 40 min, and the fiber was withdrawn for desorbing into the GC-MS insertion port for 3 min by GC-MS. The chromatographic parameters were as follows: the carrier gas was helium, the flow rate was 1.0 mL/min, the injection port temperature was 250°C, the column temperature was started at 40°C, maintained for 5 min, and then increased to 230°C (5°C/min) for 8 min. The mass spectrometry conditions were as follows: the ion source temperature was 200°C, the ionization mode was EI, the electron energy was 70 eV, and the scanning mass range was 35–500 amu (He et al., 2020).

Lipid extraction

The samples were spiked with the appropriate amount of internal lipid standard, and then homogenized with 200 μL water and 240 μL methanol. Then 800 μL of methyl t-butyl ether was added to the mixture. The mixture was sonicated for 20 min at 55°C and then allowed to stand for 30 min at room temperature. The upper layer of organic solvent was removed by centrifugation at 14,000×g for 15 min. The samples were dried under nitrogen.

Liquid chromatography with tandem mass spectrometry for the analysis of the lipidome in muscle

A CSH C18 column (1.7 μm, 2.1 mm×100 mm, Waters, Milford, MA, USA) was applied for LC separation. Lipid extracts were dissolved in 200 μL of 90% isopropanol-acetonitrile and incubated at 14,000 g for 15 min. Finally, 3 μL of the specimen was injected. The first mobile phase was 40% acetonitrile-isopropanol (1:9, v/v) at a flow rate of 300 μL per min. This was maintained for 3.5 min, followed by a linear increase to 75% acetonitrile-isopropanol (1:9, v/v) in 9 min. A linear increase to 99% acetonitrile-isopropanol for 6 min and then equilibration at 40% acetonitrile-isopropanol for 5 min.

The mass spectra were collected by the Q-Exactive Plus in the positive mode and in the negative mode, respectively. The ESI parameters were adjusted and optimized for all experiments. The experimental parameters were as follows: the source temperature was 300°C, the capillary temperature was 350°C, the ion spray voltage was 3,000 V, and the instrument scan range was 200–1,800 m/z (Tang et al., 2023).

Statistical analysis

Results of the study were presented as mean±SD in this assay with three replicates for each sample. SPSS 22.0 (IBM, Armonk, NY, USA) was used to analyze the regular nutritional composition data statistically. Orthogonal partial least squares discriminant analysis (OPLS-DA), variable importance in projection (VIP)>1, p-value<0.05 was defined as the criterion for significant differences.

Results and Discussion

Analysis of chemical components and muscle fiber parameters

There was no significant difference in the results of routine nutrient content measurements (Table 1) at pH45min, moisture, ash, and EE, but the CIE a*, CIE b*, and CIE L* of PM were significantly higher than LD and BF (p<0.05). The CIE a* is associated with meat hemoglobin content, CIE b* is negatively correlated with muscle freshness, and CIE L* is related to muscle whiteness (Liang et al., 2023). Therefore, we hypothesized that PM has the highest hemoglobin content and LD has the best freshness, which may be more popular with consumers in terms of meat color. The rank order of CP levels in three parts of Chaka sheep was: LD>BF>PM.

Table 1. The routine nutrient composition of different parts of muscles
Items Groups p-value
LD PM BF
pH45min 6.24±0.055 6.23±0.148 6.31±0.038 0.507
CIE L* 31.67±1.155b 51.33±0.577a 50.00±3.606a <0.001
CIE a* 29.67±2.082c 39.33±1.155a 34.33±1.528b 0.001
CIE b* 13.00±2.000b 17.67±1.528a 16.67±1.528a 0.034
MSTR (%) 71.50±0.700 70.53±3.150 72.33±2.139 0.637
Ash (%) 1.99±0.138 2.07±0.172 1.99±0.137 0.797
EE (%) 11.95±0.574 13.17±0.477 13.04±1.101 0.125
CP (%) 22.63±0.379a 20.03±0.764c 21.20±0.625b 0.006

The MSTR, Ash, CP and EE are on a dry matter basis.

a–c Means within a row with different subscripts differ when p-value<0.05.

LD, longissimus dorsi; PM, psoas major; BF, biceps femoris; MSTR, moisture; Ash, ash; EE, ether extract; CP, crude protein.

Download Excel Table

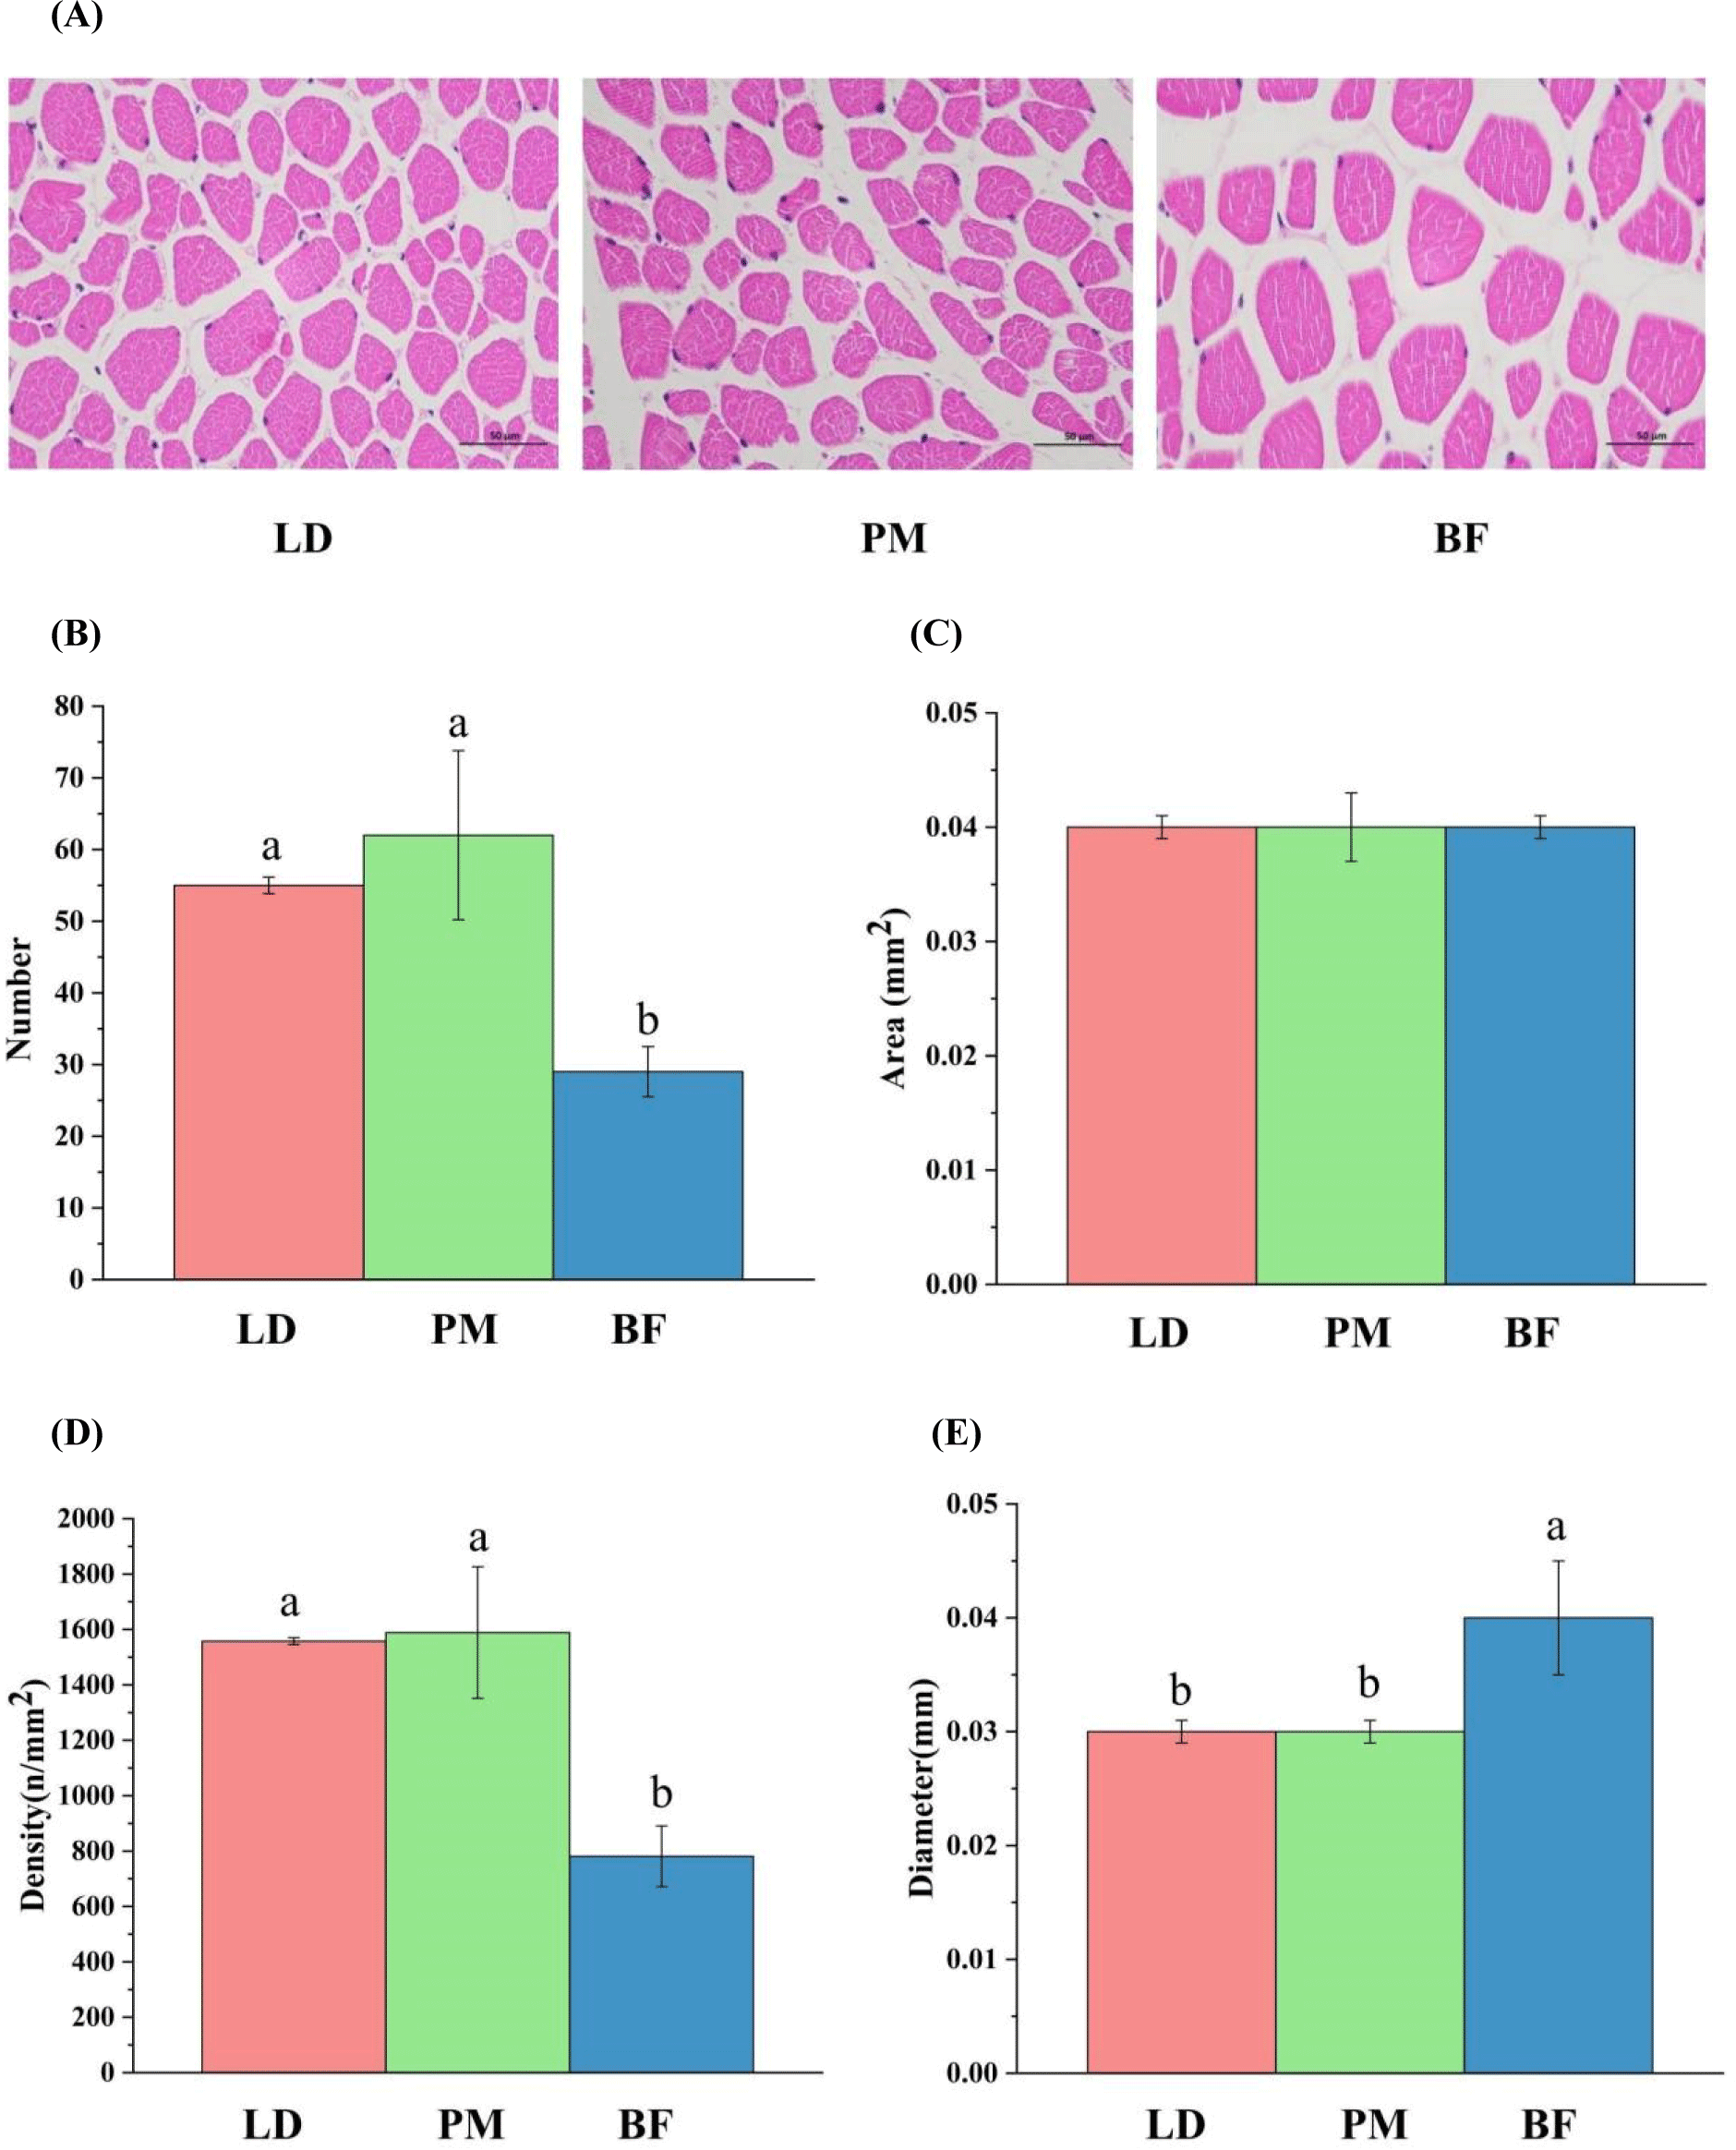
Previous studies showed that muscle fiber properties, such as type, size and total number of fibers in different parts were different, the higher muscle fiber density, the higher economic value of meat (Qin et al., 2020). The results of myofiber measurements are shown in Fig. 2, the total area of myofibers did not differ significantly between LD, PM, and BF, the total number of myofibers was ranked from most to least: PM>LD>BF, the density of myofibers was ranked: PM>LD>BF, the diameter of myofibers was the largest in BF. Our study demonstrated significant differences in total myofiber number, myofiber density, and myofiber diameter in LD, PM, and BF (p<0.05). The myofiber density in LD (1,557.93 n/mm2) and PM (1,588.74 n/mm2) were significantly higher than in BF (781.11 n/mm2), so it may suggested that LD and PM have a higher commercial value than BF.
kosfa-44-6-1305-g2
Fig. 2. Characteristics of muscle fibers in different parts of the muscles. (A) Hematoxylin and eosin (H&E) staining, bar=50 μm, (B) total number, (C) total area, (D) the density, and the diameter (E) of muscle fibers in selected filed of view. a,b Means within a row with different subscripts differ when p-value<0.05. LD, longissimus dorsi; PM, psoas major; BF, biceps femoris.
Download Original Figure
Determination of amino acids and fatty acids

The results of amino acid measurement are presented in Table 2, the total amino acid and essential amino acid levels in different parts of Chaka sheep were not significant, but our previous study has indicated that there were differences in CP content. This inconsistency may be caused by calculating CP based on nitrogen content. However, in addition to protein, meat also includes other nitrogenous compounds such as phospholipids (PLs; Gao et al., 2022), so the level of CP was not exactly equal to TAA. There were significant differences in the levels of aspartic acid, glycine, histidine, and proline in different parts of the muscle. The contents of aspartic acid and histidine were the highest in LD, followed by BF, and the lowest in PM. The contents of glycine and proline were in the following order high to low: BF>LD>PM. Studies have indicated that the free precursor amino acids affect the flavor of the meat, which is essential in evaluating the quality of the meat (Tian et al., 2021), glycine often imparts a sweet flavor to mutton, aspartate gives the meat and umami taste, and favorited by consumers (Ribeiro de Araújo Cordeiro et al., 2020). Histidine is essential for producing histamine, a chemical messenger essential for immune reactions, digestion, and sleep/wake cycles (Zhang et al., 2022a). LD had the highest levels of aspartic acid and histidine, and BF had the highest levels of total glycine and proline, from which we hypothesized that the flavors of LD and BF might be more likely to be preferred by consumers.

Table 2. The amino acid content in different parts of Chaka sheep
Items (%) Groups p-value
LD PM BF
Asparticacid 5.72±0.265a 5.23±0.172b 5.34±0.119b 0.049
Threonine 2.95±0.173 2.70±0.092 2.93±0.258 0.257
Serine 2.32±0.170 2.12±0.113 2.29±0.369 0.581
Glutamicacid 11.53±0.644 10.61±0.332 11.58±1.324 0.373
Glycine 3.05±0.040a 2.66±0.104b 3.40±0.358a 0.015
Alanine 3.79±0.156 3.46±0.053 3.94±0.290 0.056
Cystine 0.34±0.074 0.44±0.093 0.46±0.198 0.519
Valine 3.32±0.159 3.09±0.035 3.35±0.178 0.118
Methionine 1.16±0.150 1.02±0.163 0.97±0.244 0.564
Isoleucine 3.32±0.140 3.07±0.047 3.29±0.156 0.097
Leucine 5.38±0.250 5.00±0.100 5.33±0.333 0.206
Tyrosine 2.13±0.270 1.94±0.083 1.99±0.404 0.725
Phenylalanine 3.56±0.255 3.20±0.042 3.19±0.183 0.081
Histidine 2.76±0.157a 2.20±0.026b 2.53±0.202b 0.010
Lysine 5.73±0.253 5.20±0.137 5.53±0.397 0.147
Arginine 4.37±0.187 3.95±0.165 4.47±0.405 0.122
Proline 2.55±0.064a 2.17±0.242b 2.88±0.320a 0.028
EAA 28.17±1.344 25.49±0.478 27.12±1.605 0.096
NEAA 35.80±1.540 32.57±0.958 36.34±2.740 0.100
TAA 63.97±2.873 58.06±1.400 63.46±4.327 0.106

The content of amino acids (%) in this study is expressed as the percentage of amino acids per unit mass of the sample.

EAA=Threonine+Valine+Methionine+Isoleucine+Leucine+Phenylalanine+Histidine+Lysine+Arginine.

NEAA=TAA–EAA.

a,b Means within a row with different subscripts differ when p-value<0.05.

LD, longissimus dorsi; PM, psoas major; BF, biceps femoris; EAA, essential amino acids; NEAA, nonessential amino acids; TAA, total amino acids.

Download Excel Table

Fatty acids are closely related to the eating quality of meat by determining the melting point and quality of meat fats (Dai et al., 2024). The contents of fatty acids in different parts of the muscle are shown in Table 3. A study has shown that intramuscular fat content was positively correlated with SFA (Zhang et al., 2019), which was consistent with the composition of crude fat in PM, LD, and BF in our findings. The content of linoleic acid (C18:2n6c) was, in decreasing order, ranked as follows: PM>BF>LD. Haag’s study found that eicosapentaenoic acid (EPA) and docosahexaenoic acid (DHA) are metabolic byproducts of linoleic acid and linolenic acid, which are vital to the human body in the maintenance of cardiovascular health, brain function, and the reduction of pain in rheumatoid arthritis (Haag, 2003; Oh, 2005). Therefore, we hypothesized that the higher linoleic acid in PM would favor the production and accumulation of EPA and DHA. The total of ω-6 polyunsaturated fatty acid (PUFA) was ranked as: PM>BF>LD. Studies have found that ω-6 PUFA cannot be produced by the body, but must be consumed in the diet, and meat is an essential source of ω-6 PUFA. It is recommended that people should get these nutrients through a balanced diet to maintain the body’s ω-6 PUFA level (Simopoulos, 2008). Overall, our results indicated that there were differences in the fatty acid content of muscles from Chaka sheep, the PM exhibited the highest nutritional value in the fatty acids profile.

Table 3. The fatty acid content in different parts of Chaka sheep
Items (%) LD PM BF p-value
∑SFA 44.83±2.272b 49.19±1.003a 48.97±0.336a 0.021
C4:0 0.03±0.008 ND 0.02±0.004 -
C6:0 0.01±0.002 0.01±0.002 0.02±0.001 0.560
C8:0 0.01±0.008 0.01±0.004 0.01±0.000 0.847
C10:0 0.15±0.006 0.17±0.012 0.16±0.055 0.767
C11:0 ND 0.003±0.000 0.003±0.000 -
C12:0 0.06±0.001 0.09±0.006 0.08±0.017 0.066
C13:0 0.01±0.001 0.01±0.002 0.02±0.002 0.437
C14:0 2.07±0.112 2.37±0.052 2.42±0.363 0.198
C15:0 0.28±0.006c 0.44±0.045a 0.36±0.046b 0.005
C16:0 21.49±0.855 27.14±1.521 29.40±4.087 0.471
C17:0 1.04±0.044b 1.45±0.097a 1.29±0.209a 0.025
C18:0 20.21±2.357 16.82±1.009 13.72±0.566 0.125
C20:0 0.06±0.003b 0.12±0.016a 0.04±0.018c 0.011
C21:0 0.25±0.017 0.34±0.079 0.28±0.050 0.184
C22:0 0.11±0.021 0.12±0.019 0.09±0.028 0.386
C23:0 0.05±0.006 0.06±0.010 0.05±0.018 0.317
C24:0 0.02±0.006 0.03±0.006 0.02±0.008 0.456
∑MUFA 1.29±0.094 1.41±0.037 1.50±0.070 0.107
C14:1 0.11±0.003c 0.17±0.007a 0.13±0.026b 0.016
C15:1 0.16±0.007c 0.22±0.003a 0.17±0.024b 0.005
C16:1 1.23±0.207 1.26±0.134 1.56±0.303 0.278
C17:1 0.48±0.057 0.58±0.043 0.63±0.093 0.095
C18:1n9t ND ND ND -
C18:1n9c 42.41±3.328 40.08±1.079 44.70±1.840 0.120
C22:1n9 0.02±0.003 0.02±0.003 0.01±0.005 0.969
C20:1 0.11±0.001a 0.15±0.022a 0.08±0.003b 0.036
C24:1 0.14±0.021a 0.10±0.012b 0.15±0.007a 0.012
∑PUFA 0.17±0.022 0.27±0.035 0.22±0.040 0.067
C18:2n6t ND ND ND -
C18:2n6c 3.32±0.439b 5.03±0.770a 3.90±0.629b 0.040
C18:3n6 0.54±0.015 0.83±0.048 0.76±0.015 0.064
C18:3n3 0.15±0.018 0.16±0.019 0.15±0.041 0.840
C20:2 ND ND ND -
C20:3n3 0.26±0.020 0.24±0.055 0.27±0.047 0.710
C20:3n6 0.87±0.037 1.10±0.154 0.92±0.068 0.063
C20:4n6 0.08±0.002 0.10±0.009 0.07±0.001 0.060
C20:5n3 0.65±0.010 0.66±0.086 0.70±0.014 0.865
C22:2 0.02±0.002 0.02±0.008 0.02±0.005 0.207
C22:6n3 0.11±0.036 0.10±0.001 0.09±0.002 0.465
∑UFA 50.71±2.990 50.82±1.004 54.32±0.985 0.099
SFA/UFA 0.97±0.103 1.00±0.039 0.83±0.011 0.057
PUFA/SFA 0.12±0.006 0.17±0.024 0.15±0.024 0.080
ω-3 PUFA 1.17±0.153 1.16±0.148 1.21±0.213 0.938
ω-6 PUFA 4.81±0.553c 7.06±0.955a 5.65±0.849b 0.037
ω-6/ω-3 PUFA 4.18±0.769c 6.07±0.170a 4.69±0.194b 0.006

∑SFA=C4:0+C6:0+C8:0+C10:0+C11:0+C12:0+C13:0+C14:0+C15:0+C16:0+C17:0+C18:0+C20:0+C21:0+C22:0+C23:0+C24:0.

∑MUFA=C14:1+C15:1+C16:1+C17:1+C18:1n9t+C18:1n9c+C22:1n9+C20:1+C24:1.

∑PUFA=C18:2n6t+C18:2n6c+C18:3n6+C18:3n3+C20:2+C20:3n3+C20:3n6+C20:4n6+C20:5n3+C22:2+C22:6n3.

∑UFA=∑MUFA+∑PUFA.

ω-3 PUFA=C18:3n3+C20:3n3+C20:5n3+C22:6n3.

ω-6 PUFA=C18:2n6t+C18:2n6c+C18:3n6+C20:3n6+C20:4n6.

a–c Means within a row with different subscripts differ when p-value<0.05.

LD, longissimus dorsi; PM, psoas major; BF, biceps femoris; SFA, saturated fatty acids; MUFA, monounsaturated fatty acid; PUFA, polyunsaturated fatty acid; UFA, unsaturated fatty acids; ND, not detected.

Download Excel Table
Determination of volatile flavor compounds

As presented in Table 4, aldehyde, alcoholic, ketonic, carboxylic, esteric, and other volatile aroma compounds have been identified in Chaka sheep muscle. There were marked differences in the alcohols, ketones, and esters of the Chaka sheep, with PM having the highest levels of total alcohols, ketones, and esters. Alcohols are derived from the breakdown of lipids and have a high olfactory threshold and a generally clear odor similar to that found in fruits and vegetables. Ketones, a category of volatile organic compounds with floral, fruity, and creamy aromas, have an impact on the overall flavor of meat products (Ge et al., 2023). Ester compounds, most of which have an aromatic flavor, are formed by the interesterification of acids and alcohols (Yang et al., 2024). We found that the PM exhibited the highest nutritional value in the fatty acids profile, so we speculated that the higher fatty acid oxidation may lead to the accumulation of flavor substances in PM.

Table 4. The content of volatile flavor substances in three parts of muscle
Items (%) Groups p-value
LD PM BF
Aldehydes 62.94±5.997 64.39±0.428 57.33±8.095 0.356
Pentanal 0.24±0.051 0.64±0.333 0.36±0.117 0.131
2-Thiophene formaldehyde 0.21±0.059b 0.75±0.095a 0.32±0.656a <0.001
Hexanal 4.28±0.144c 7.30±0.460a 6.13±0.254b <0.001
Heptanal 4.67±0.879 5.09±0.511 3.84±0.421 0.124
Octanal 3.65±0.445a 3.43±0.235a 2.85±0.202b 0.049
Nonanal 13.78±0.677a 9.62±0.652b 12.37±0.928a 0.002
Methylthiopropionaldehyde ND 0.26±0.046 0.43±0.252 -
Decanal 1.39±0.300a 0.66±0.055b 0.51±0.060c 0.002
Benzaldehyde 21.24±3.623b 26.89±0.206a 21.40±1.003a 0.031
2-Decenal,(E) 2.17±0.089c 3.57±0.115b 3.65±0.061a <0.001
2-Undecenal 3.72±0.498a 2.59±0.500b 3.11±0.245a 0.049
2-Phenyl-2-butylenaldehyde 0.79±0.055 ND 0.77±0.131 -
(E,E)-2,4-heptadienal 0.73±0.305b 0.58±0.036b 0.97±0.060a 0.001
Pentadecanal 1.26±0.350a 0.54±0.120b 0.68±0.064b 0.014
Hexadecanal 9.35±0.291a 2.53±0.325b 3.86±0.127c <0.001
Alcohols 6.60±0.801b 9.11±0.367a 6.53±0.332b 0.002
1-Pentanol 0.78±0.078b 1.02±0.076a 0.41±0.031c <0.001
1-Hexanol 0.44±0.099b 0.72±0.066a 0.41±0.031b 0.003
2-Furanmethanol 0.37±0.097 1.34±0.061 ND -
1-Octen-3-ol 1.55±0.387c 2.21±0.125b 2.38±0.097a 0.012
Heptanol 0.93±0.119b 1.31±0.070a 0.75±0.157c 0.004
Octanol 1.86±0.211a 1.96±0.060a 0.75±0.157b <0.001
(E)-2-Octene-1-ol 0.67±0.721 0.55±0.047 0.53±0.096 0.117
Ketones 1.72±0.180c 2.51±0.165a 2.33±0.110b 0.002
2-Pentadecanone 0.58±0.085b 0.53±0.057b 0.74±0.101a 0.044
3-Hexanone 0.13±0.045c 0.36±0.081b 0.44±0.049a 0.002
2,3-Octanedione 0.78±0.082b 1.45±0.096a 0.90±0.144a 0.001
6-Methyl-5-hepten-2-one 0.23±0.061 0.29±0.060 0.25±0.035 0.426
Hydrocarbons 5.78±0.700 5.82±0.180 5.63±0.474 0.331
Heptylbenzene 1.99±0.125a 1.02±0.026b 1.41±0.248a 0.035
Xylene 1.76±0.371a 1.25±0.060b 0.70±0.099c 0.004
Octylbenzene 1.17±0.154b 1.14±0.072b 1.85±0.901a 0.001
Nonylbenzene 0.86±0.146 1.14±0.072 1.07±0.140 0.073
Hexadecane ND 1.03±0.176 0.60±0.056 -
Esters 0.47±0.129c 1.03±0.110a 0.86±0.061b 0.007
2-Ethyl ethyl acetate ND 0.12±0.050 0.27±0.064 -
Methyl diethyldithiocarbamate 0.47±0.129b 0.91±0.131a 0.60±0.012a 0.006
Others 9.94±1.023 9.34±0.793 8.15±0.475 0.081
2-(pentenyl) furan 1.50±0.280b 5.41±0.720a 4.03±0.243a <0.001
2-Acetyl thiazole 0.15±0.0252c 0.45±0.111b 0.48±0.090a 0.006
trans-2-(Pentenyl)furan 1.40±0.627 1.23±0.326 1.20±0.247 0.832
2-Acetyl pyrrole 1.49±0.148 1.30±0.303 1.50±0.295 0.594
Acetoin 3.60±0.246b 0.64±0.061a 0.64±0.180a <0.001
Dimethyl disulphide 0.18±0.030a 0.13±0.031b 0.12±0.021b 0.048
Dimethyl trisulfide 0.27±0.021a 0.18±0.012b 0.21±0.558a 0.015

a–c Means within a row with different subscripts differ when p-value<0.05.

LD, longissimus dorsi; PM, psoas major; BF, biceps femoris; ND, not detected.

Download Excel Table
Lipid profiles analysis
The lipid composition analysis in different muscle parts

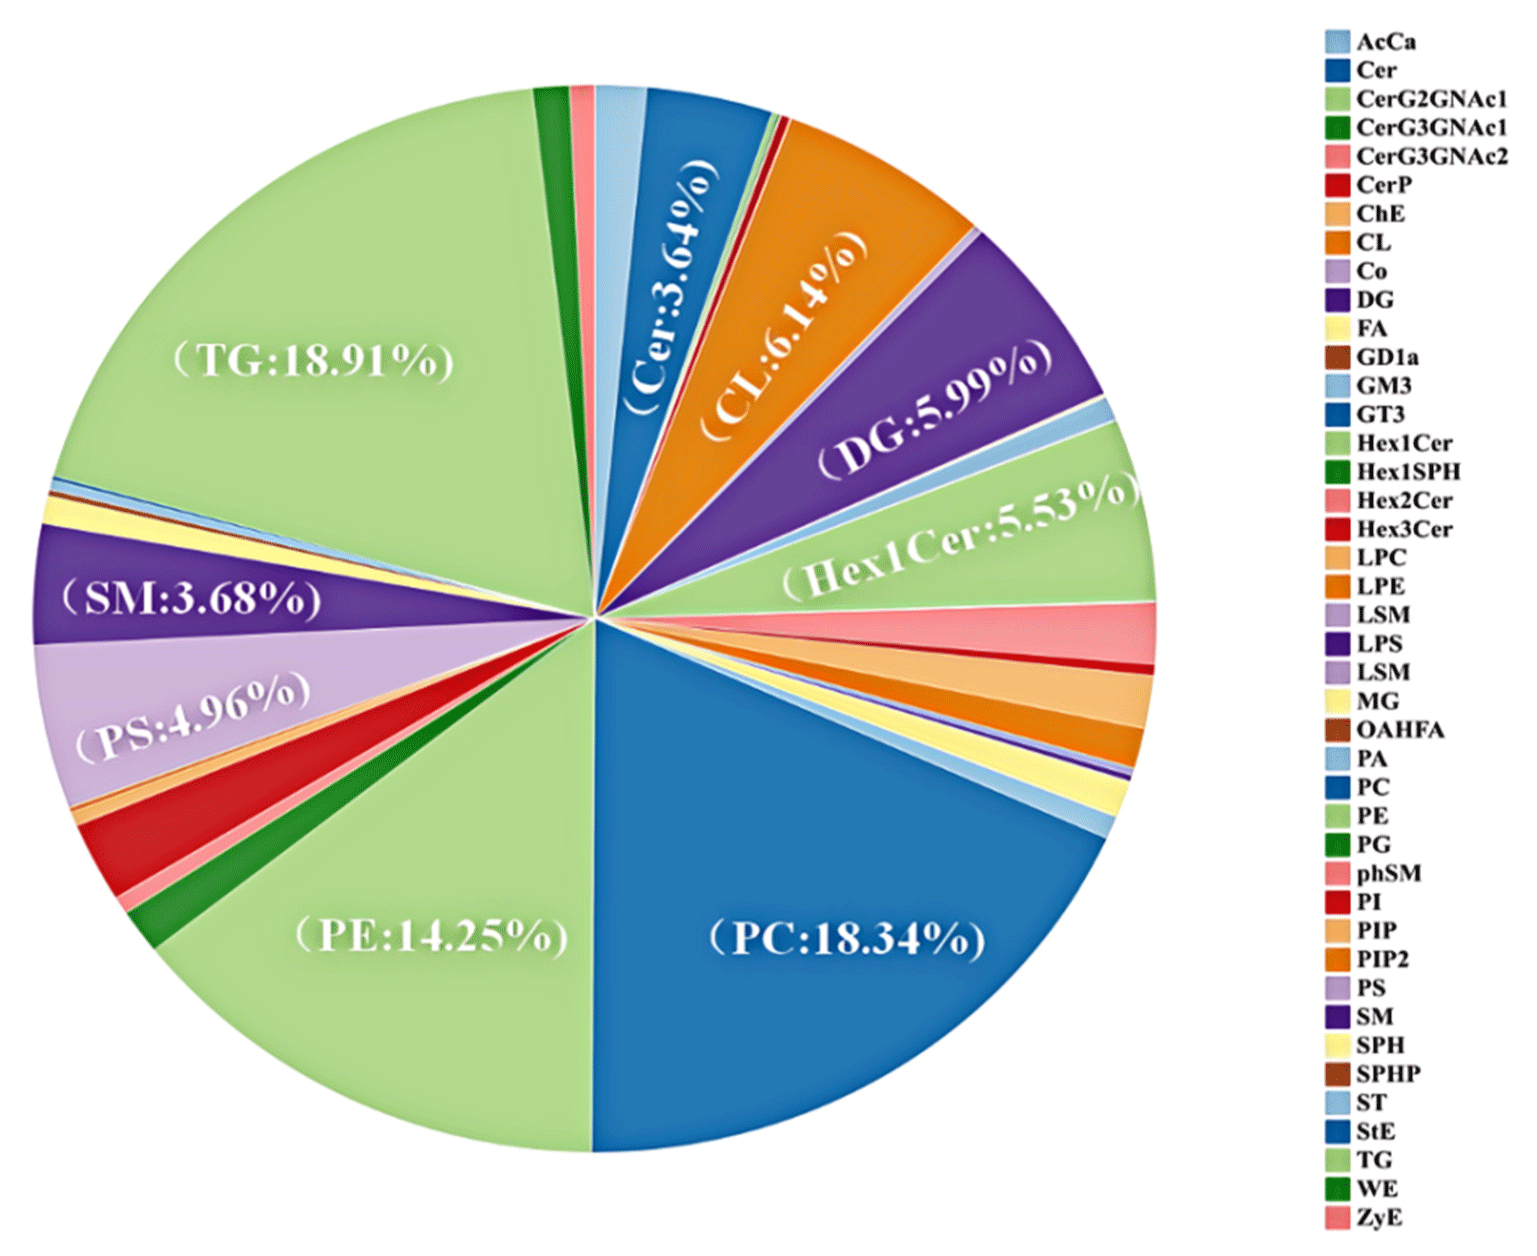
Lipids play an essential role in the production of the odor and the flavor of meat via autoxidation or thermal oxidation (Li et al., 2021). A detailed classification of the categories is crucial for the analysis of the metabolic pathways that underlie the transformation of lipids (Enser et al., 1999). A total of 2,639 lipid molecule species were detected in the Chaka sheep. The lipids were composed of 42 categories (Fig. 3), and the percentages of content, in descending order, were: triacylglycerol (TG: 18.91%), phosphatidylcholine (PC: 18.34%), phosphatidylethanolamine (PE: 14.25%), cardiolipid (CL: 6.14%), diacylglycerol (DG: 5.99%), monosaccharide ceramide (Hex1Cer: 5.53%), phosphatidylserine (PS: 4.96%), sphingomyelin (SM: 3.68%), ceramide (Cer: 3.64%) and others. Intramuscular fat is composed of PLs, TGs, and cholesterol, and the balance between triglyceride synthesis, breakdown, and absorption is reflected in IMF content (Roy et al., 2024). The effect of the lipid content on aroma retention is greater than the influence of the lipid type (Ayed et al., 2018). TGs and PLs have been shown to be the predominant lipids for predominant lipids for binding and generating flavor compounds (Fu et al., 2022). Liu’s study suggested that the highest types and concentrations of TG may contribute primarily to aroma retention in roasted mutton (Liu et al., 2022). Therefore, our hypothesis was that the high TG levels in Chaka sheep might be correlated with the taste of the meat. PC, PE, and CL being the major components of PLs. Zhou’s study found that the different PL forms (PC and PE) not only can regulate membrane fluidity and permeability but also are important components of PLs (Zhou et al., 2014). PLs, which accounted for almost half of the total number of molecules of lipid classes, were predominant in these three samples in our study. A study showed that PLs are abundant in PUFAs and are an essential resource of PUFAs (Zhou et al., 2013), and the flavor of meat is associated with the composition of PLs (Wu and Wang, 2019). Wang et al. (2009) found that the PLs were the main factor in forming the flavor of duck meat products, which also was one of the major determinants of the taste of duck meat products. Therefore, we hypothesized that the flavor of Chaka sheep would be associated with the levels of PLs.
kosfa-44-6-1305-g3
Fig. 3. The molecular distribution of total lipids in Chaka sheep. TG, triacylglycerol; SM, sphingomyelin; PS, phosphatidylserine; PE, phosphatidylethanolamine; PC, phosphatidylcholine; DG, diacylglycerol; CL, cardiolipid.
Download Original Figure

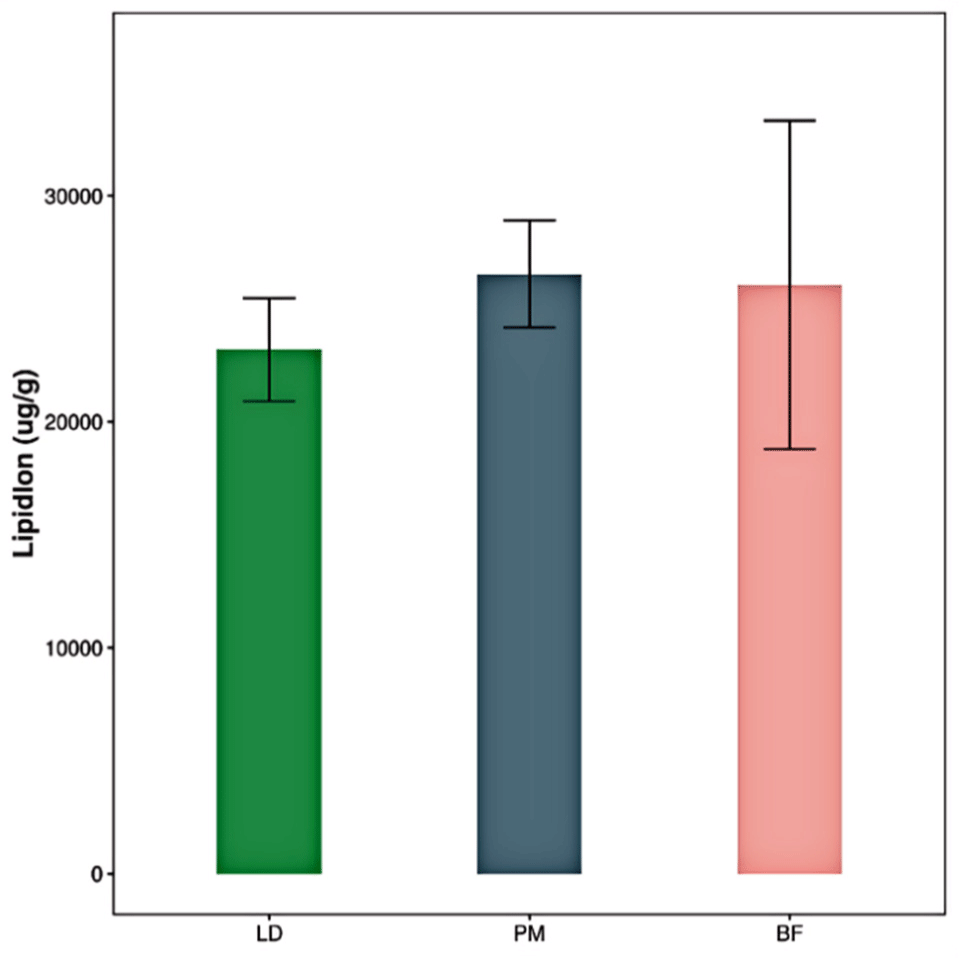
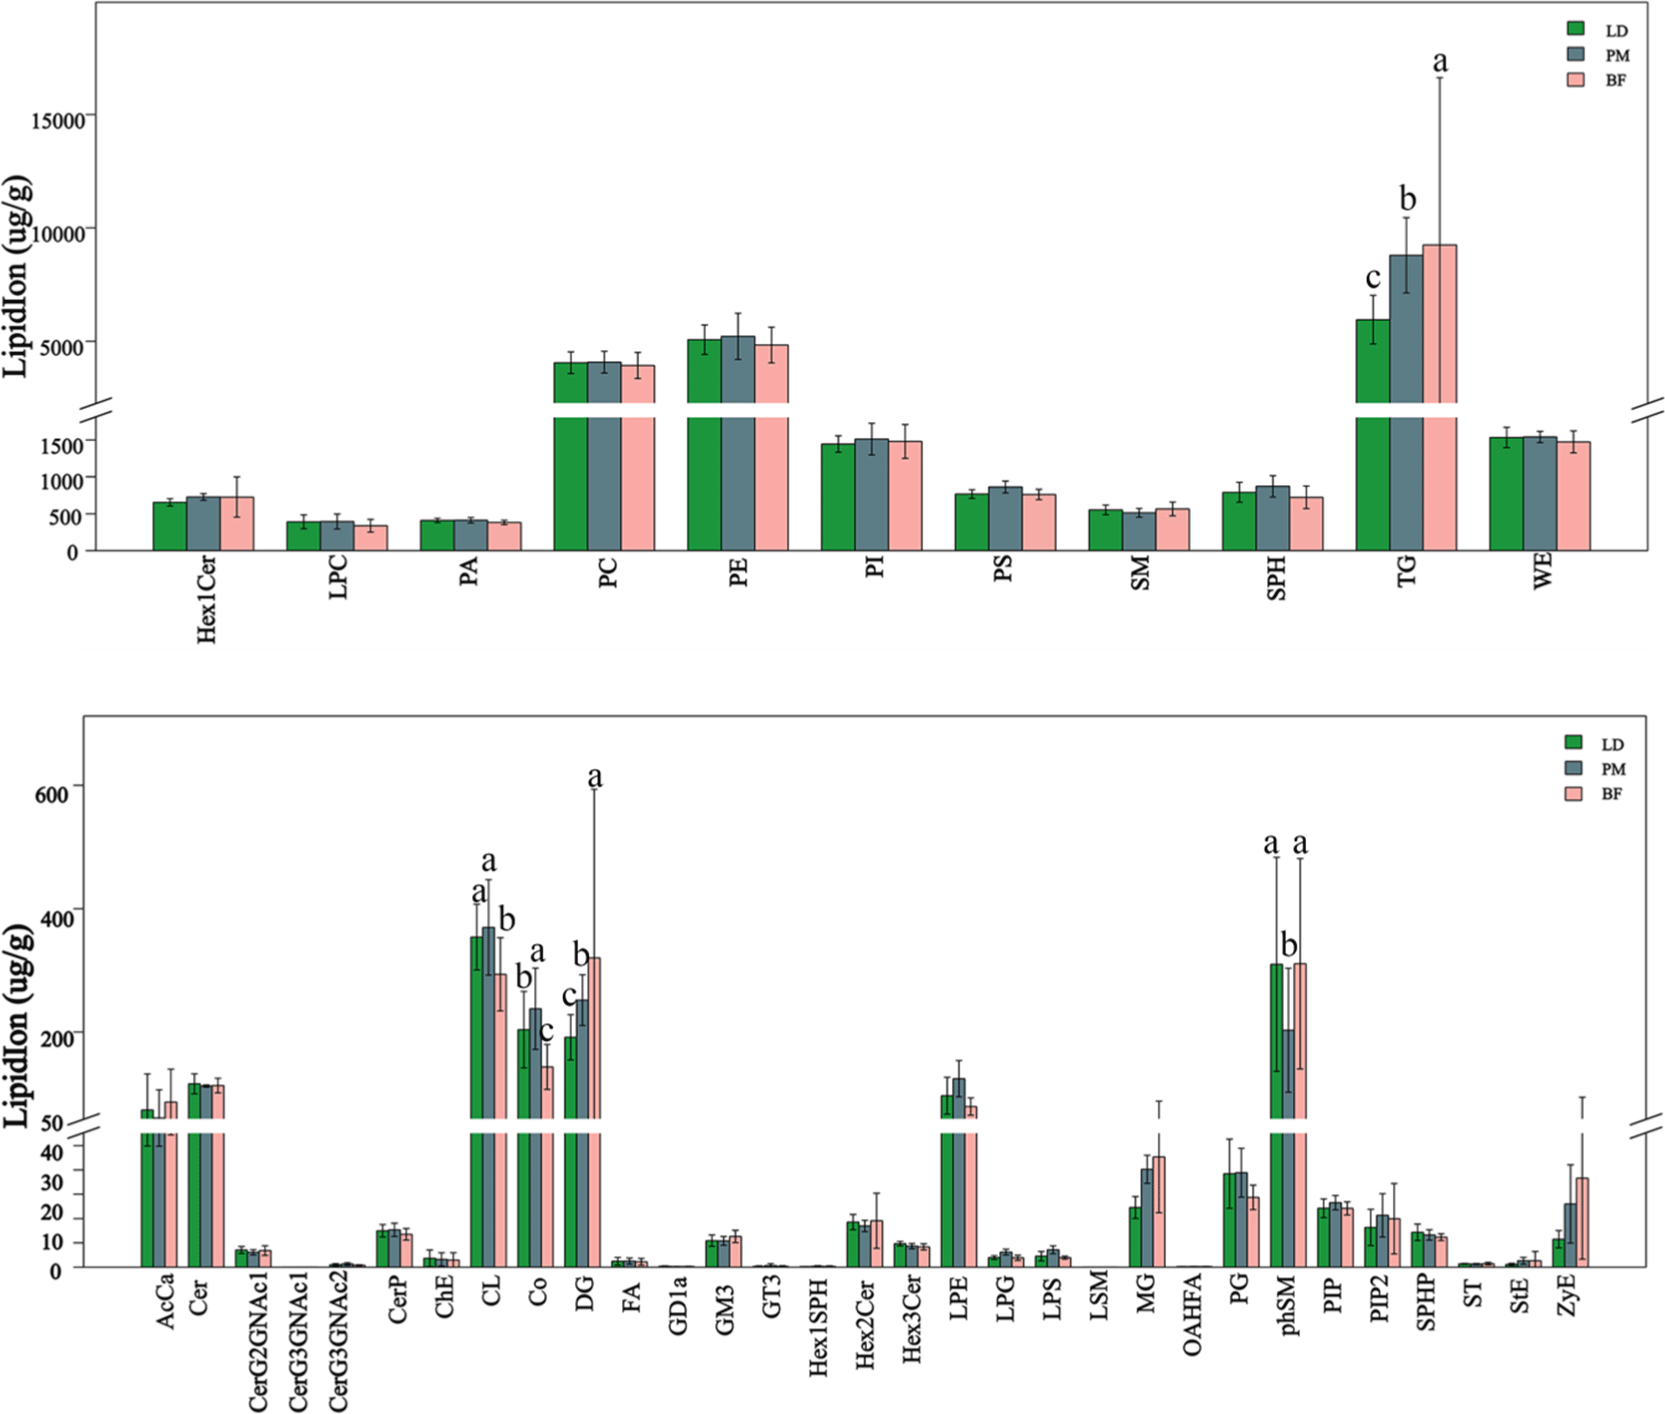
The total number of lipid molecules in the different parts of the Chaka sheep is summarized in Fig. 4. The comparative results were as follows: PM>BF>LD. The difference between the groups was not significant. The composition of lipid subclasses in different parts of the Chaka sheep is shown in Fig. 5. PC, PE, phosphatidylinositol (PI), PS, sphingosine (SPH), TG, and WE were major subclasses lipids in Chaka, and all of them were present at levels >1,000 μg/g. TG levels varied significantly among the three comparison groups, with the highest levels in the BF group, followed by the PM group, and the lowest levels in the LD group (p<0.05). PC, PE, PI, PS, and SPH were belong to PLs. PC and PE are the major PL classes in porcine intramuscular fat, and PEs are the predominant glycerophospholipid in ruminant cell membranes (Fernandez et al., 1999). In conclusion, PLs were the highest total percentage of Chaka sheep, and PLs are also essential constituents of cell membranes. Hazel’s study indicated that long-chain PUFA is more highly mobilized at low temperatures, and the higher the PL content, the higher the long-chain PUFA content, which may correlate with better plateau adaptation in yak (Hazel and Williams, 1990). Lin’s study showed that fish muscle PLs were sensitive to decreasing temperature (Lin et al., 2019). Therefore, we hypothesized that the higher levels of PLs molecules in the muscles of Chaka sheep would facilitate their adaptation to the extreme environment of the Tibetan Plateau, which is characterized by high levels of cold and hypoxia.
kosfa-44-6-1305-g4
Fig. 4. The total content of lipid molecules in different parts of Chaka sheep.
Download Original Figure
kosfa-44-6-1305-g5
Fig. 5. The composition of lipid subclasses in different parts of the Chaka sheep. a−c Indicate significant differences between the groups compared in the figure (p<0.05). LD, longissimus dorsi; PM, psoas major; BF, biceps femoris; LPC, lysophosphatidylcholine; PA, phosphatidic acid; PC, phosphatidylcholine; PE, phosphatidylethanolamine; PI, phosphatidylinositol; PS, phosphatidylserine; SM, sphingomyelin; SPH, sphingosine; TG, triacylglycerol; WE, wax esters.
Download Original Figure
The differential lipid molecular analysis

To study the significant differences in lipids between different parts of Chaka sheep, OPLS-DA model was used to evaluate differential lipids. The OPLS-DA model maximizes the between-group differences in the horizontal coordinate, while the within-group variation is reflected in the orthogonal principal components in the vertical coordinate, and it is clear in Fig. 6 that the OPLS-DA model can distinguish the two groups of samples, and the model evaluation parameter Q2<0.5, indicating that the model has a great deal of stability, and the test results are real and reliable (Zhang et al., 2022b).

kosfa-44-6-1305-g6
Fig. 6. The OPLS-DA displacement test in positive and negative ion mode. BF, biceps femoris; LD, longissimus dorsi; PM, psoas major; OPLS-DA, orthogonal partial least squares discriminant analysis.
Download Original Figure

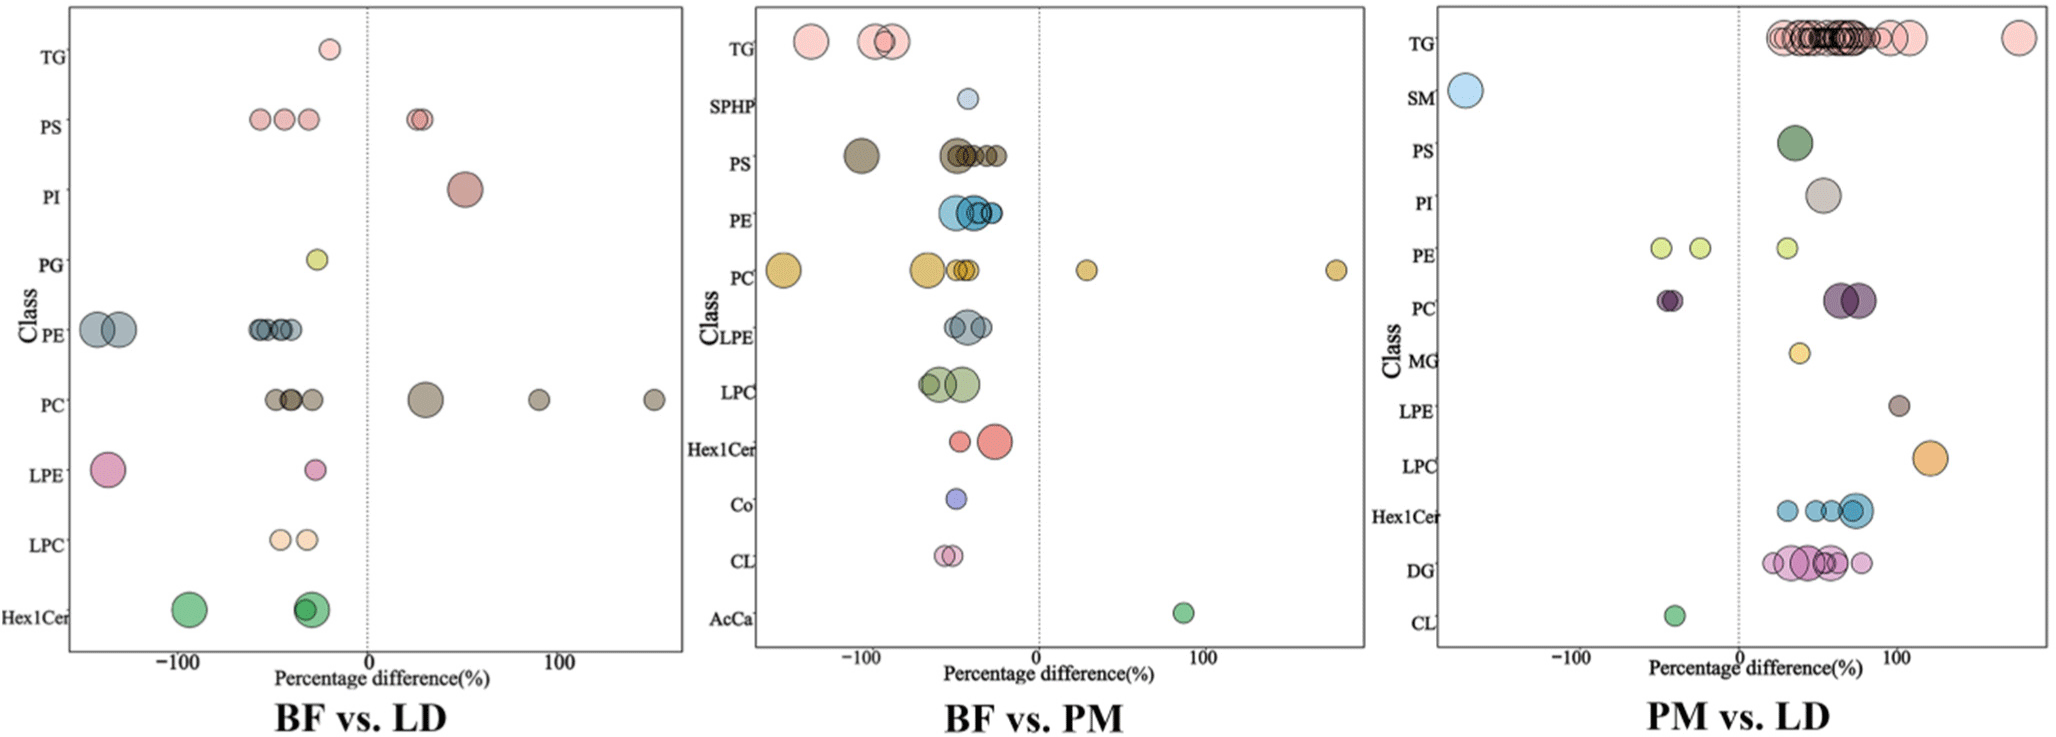
The significantly different lipid molecules (VIP>1, p<0.05) screened in this experiment were visualized in the form of bubble plots in Fig. 7. Bubbles in graph represent significantly different lipid species, and the vertical coordinates show each subclass of lipid, marked by different colors, with the size of the bubbles representing the significance of the differences. In BF, TG, PS, PI, PG, PE, PC, lysophosphatidylethanolamine (LPE), lysophosphatidylcholine (LPC), and Hex1Cer were the highly significantly different lipid molecules compared with LD. In BF vs. PM, TG, PS, PE, PC, LPE, LPC, and Hex1Cer were the main significantly different lipid molecules. In PM vs. LD, TG, SM, PS, PI, PC, LPC, Hex1Cer, and DG were the main lipids with highly significant differences. PS, PE, PC, LPC, LPE in PLs, TG in triglycerides, and Hex1Cer in SMs were the three major co-differentiating lipid molecules. In Sun’s study, PLs were found to be the main factor distinguishing the muscle lipidome between cattle-yak and yak (Sun et al., 2018; Vahmani et al., 2020), and our findings were consistent with these results. Jia’s study mainly detected AcCa, Cer, DG, LPC, PC, PE, SM, and TG, less ChE, LPE, MG, PI, and SPH, and no Co, Hex1Cer, Hex2Cer, LSM, PG in Tan sheep meat (Jia et al., 2021). However, in our study, we detected lipid molecules such as Co, Hex1Cer, Hex2Cer, LSM, and PG. These differences may be related to diet, feeding habits, and other factors (Dannenberger et al., 2017). The top 20 differential lipids in the different comparison groups are shown in the Supplementary Table S1.
kosfa-44-6-1305-g7
Fig. 7. The molecular bubble diagrams of differential lipids in different parts of Chaka sheep. BF, biceps femoris; LD, longissimus dorsi; PM, psoas major; TG, triacylglycerol; PS, phosphatidylserine; PI, phosphatidylinositol; PG, phosphatidylglycerol; PE, phosphatidylethanolamine; PC, phosphatidylcholine; LPE, lysophosphatidylethanolamine; LPC, lysophosphatidylcholine.
Download Original Figure

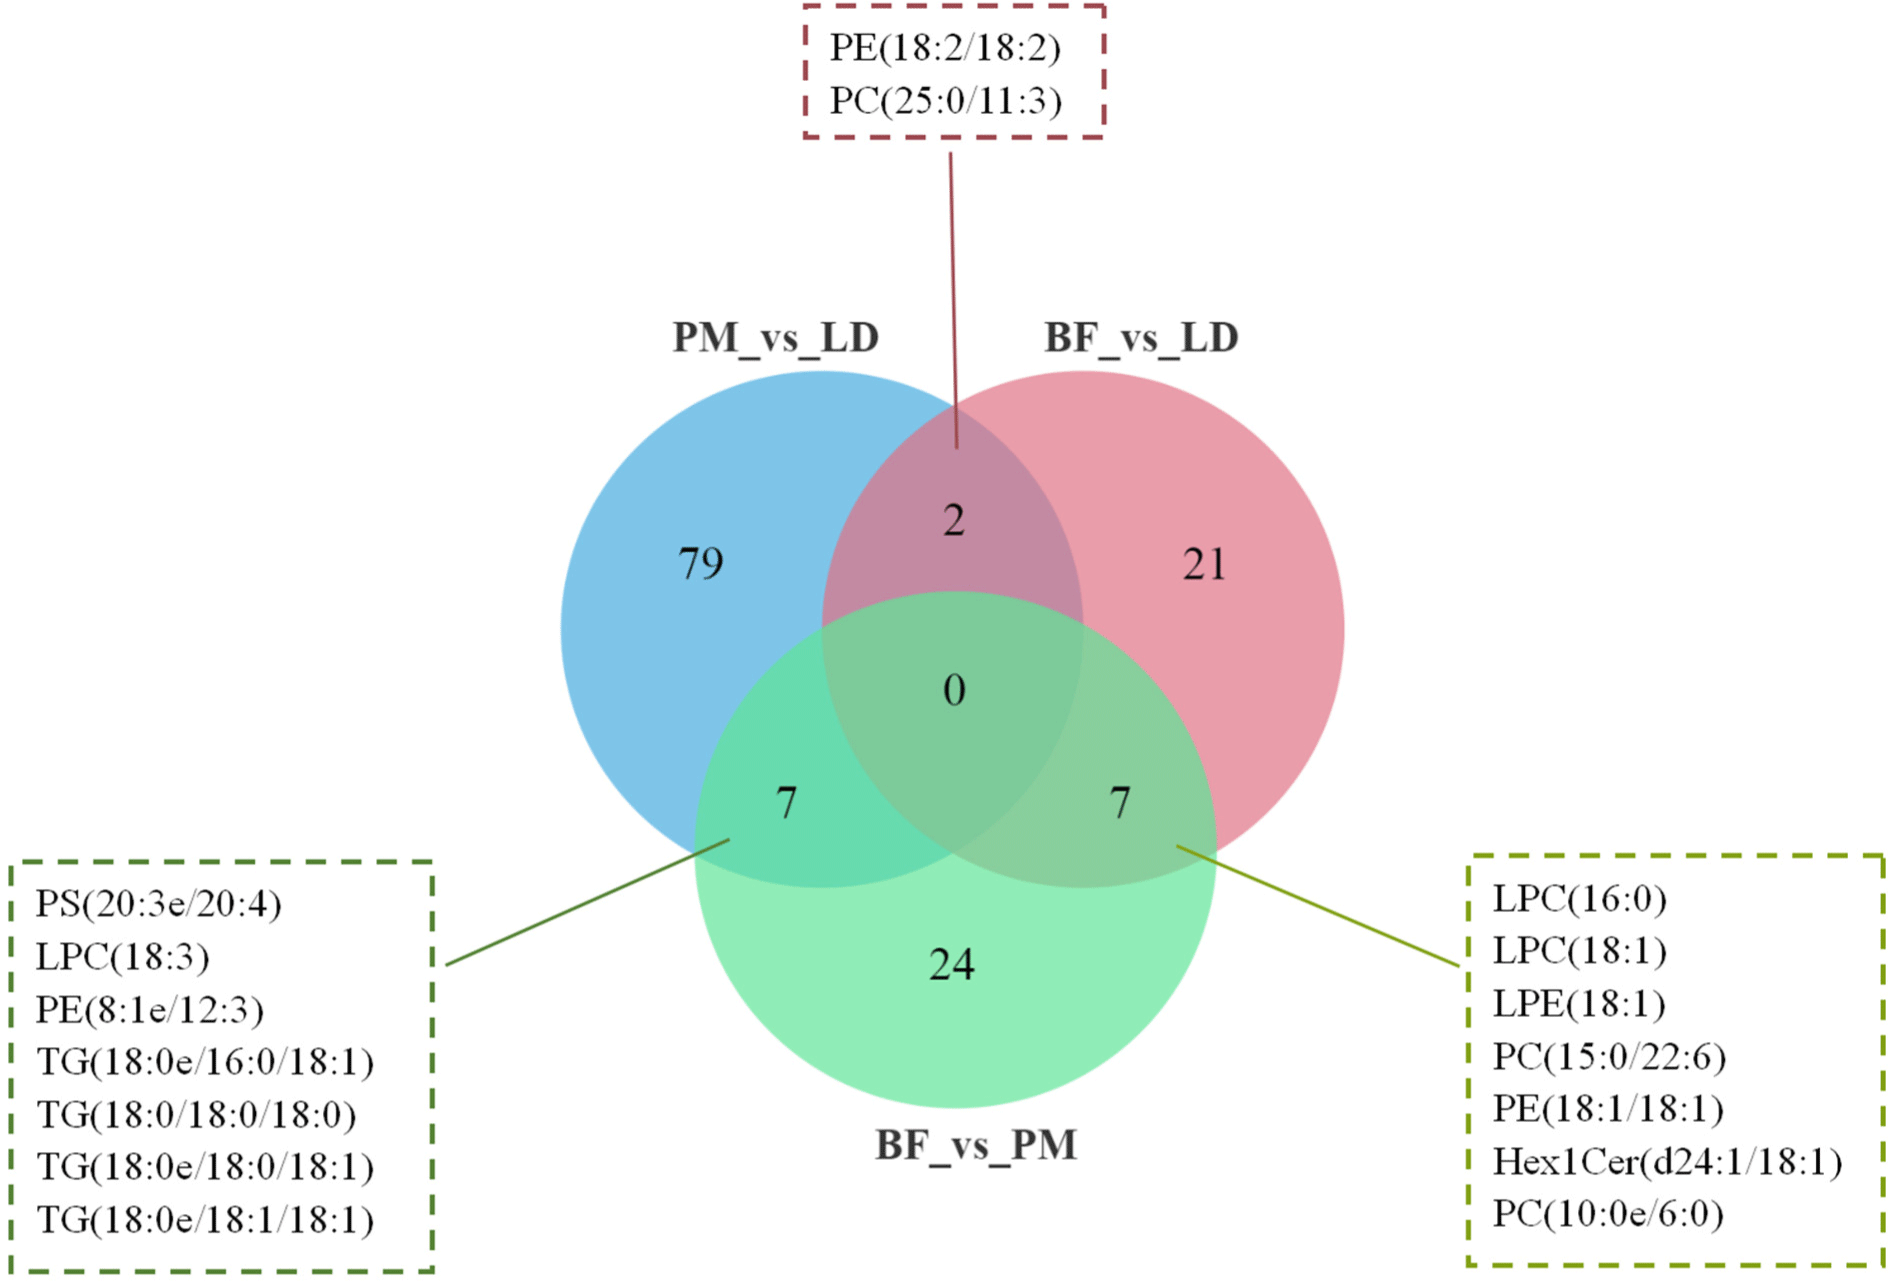
We used venn diagrams (Fig. 8) to show specific differential lipid molecules, and the results of the study showed that the numbers of significantly different lipid molecules between the different comparison groups were: 30 (BF vs. LD), 38 (BF vs. PM), and 88 (PM vs. LD). Among them, PE (18:2/18:2) and PC (25:0/11:3) were LD group-associated differential lipids. PS (20:3e/20:4), LPC (18:3), PE (8:1e/12:3), TG (18:0e/16:0/18:1), TG (18:0/18:0/18:0), TG (18:0e/18:0/18:1), and TG (18:0e/18:1/18:1) were PM group-associated differential lipids. LPC (16:0), LPC (18:1), LPE (18:1), PC (15:0/22:6), PE (18:1/18:1), Hex1Cer (d24:1/18:1), and PC (10:0e/6:0) were BF group-associated differential lipids. Dashdorj et al. (2015) found that PE (16:0/20:4), PE (18:0/19:1), and PE (18:1/22:5) were the top three lipid species, suggesting that they are the major contributors to shank/flank muscle liposome differentiation. In our study, PE (18:2/18:2) was mainly found in LD, PE (8:1e/12:3) was predominantly detected in PM, and PE (18:1/18:1) was mostly identified in BF. It can be concluded that PE is an important biomarker for the differentiation of the different parts of the muscle. Li et al. (2022b) showed that PLs containing PC and PE may be key lipids in the formation of aromatic substances in roasted lamb. Zhou et al. (2014) showed that PC is more easily oxidized to aldehydes due to its high content of unsaturated fatty acids. Guo’s study showed that PC and PE are prone to the formation of the aroma compounds (E,E)-2,4-decadienal, 1-octen-3-one and (E)-2-decene (Guo et al., 2021). Our study found significant differences in the content of the flavor compounds alcohols, ketones and esters among the three comparison groups. Therefore, we hypothesized that the cause of the differences in flavor compounds is related to the lipids PE (18:2/18:2), PE (8:1e/12:3), PE (18:1/18:1), PC (25:0/11:3), and PC (15:0/22:6). In addition, TG had a distinct influence on the volatile components and on the oral release of the most important hydrophilic volatile components. The fatty acid species contained in TG were found to affect the oxidation of volatile compounds (Frank et al., 2017). We found that volatile flavor alcohols, aldehydes, and esters were the most abundant in PM, while TG (18:0e/16:0/18:1), TG (18:0/18:0/18:0), TG (18:0e/18:0/18:1), and TG (18:0e/18:1/18:1) were the characteristic lipid molecules in PM. Alcohols have a higher taste threshold and less impact on the taste of meat compared to aldehydes (Huang et al., 2022). Studies have shown that aldehydes, usually derived from C18 PUFA such as linoleic and linolenic acids and C20 arachidonic acid, are the major products of lipid oxidation. Aldehydes have a low olfactory threshold and are important contributors to flavor (Varlet et al., 2007). Aldehydes were the highest percentage of flavor substances in our study and were significantly higher in the PM group than in the LD and BF groups. Therefore, we hypothesized that TG-like lipids are associated with the formation of aldehydes.
kosfa-44-6-1305-g8
Fig. 8. The Venn diagram of differential lipid molecules in different parts of Chaka sheep. PE, phosphatidylethanolamine; PC, phosphatidylcholine; PM, psoas major; LD, longissimus dorsi; BF, biceps femoris; PS, phosphatidylserine; LPC, lysophosphatidylcholine; PE, phosphatidylethanolamine; TG, triacylglycerol; LPE, lysophosphatidylethanolamine.
Download Original Figure
The cluster analysis and correlation of differential lipid molecules

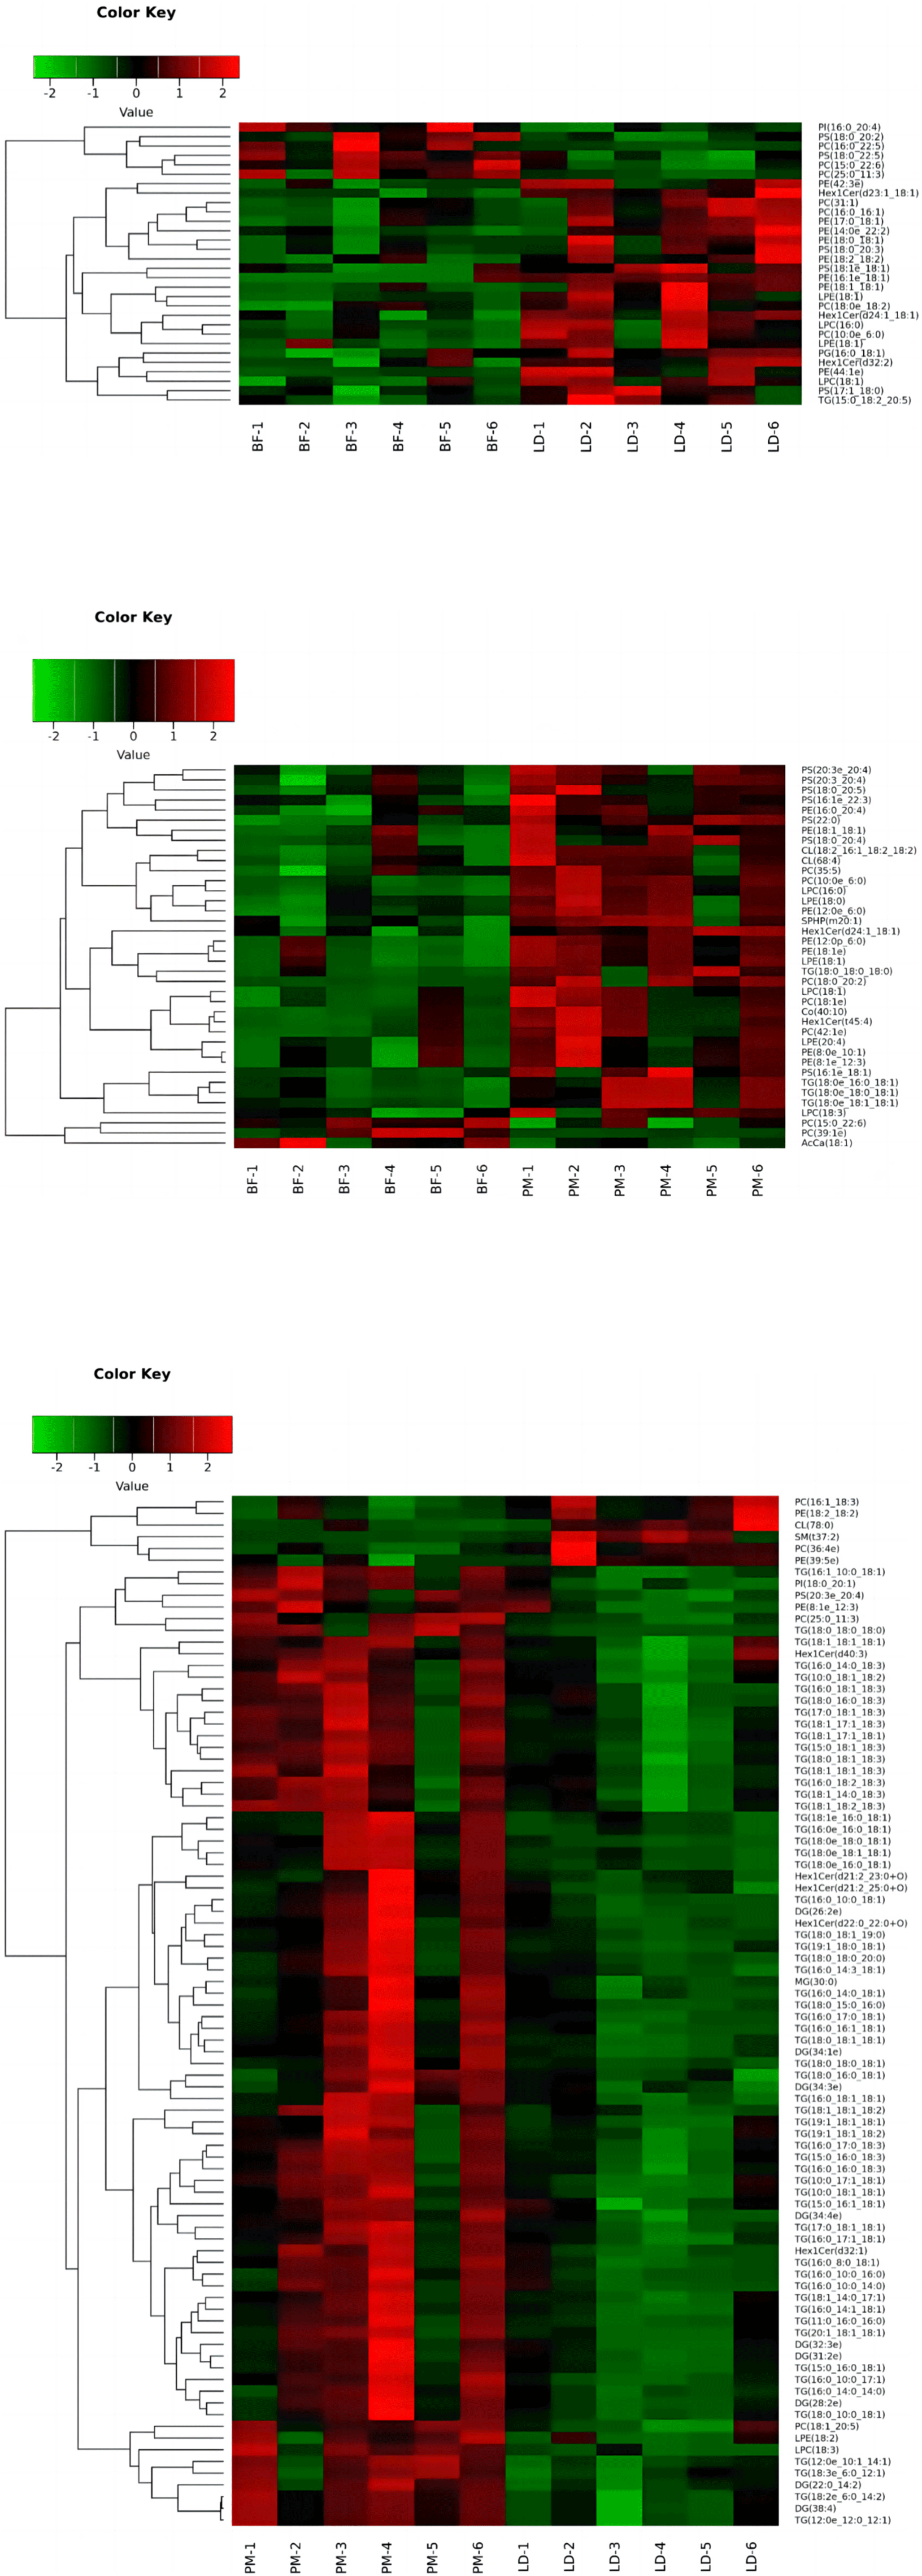
To evaluate the plausibility of differential lipids and to visualize more clearly the association between specimens and the differential expression patterns of lipids in different samples, we conducted hierarchical clustering (Fig. 9) using the expression levels of highly differential lipids (VIP>1, p-value<0.05) for each group of specimens. Differential lipids were analysed by clustering and heatmaps demonstrated significant differences in lipid profiles between the BF, LD and PM, indicating significant differences in lipid molecules in different parts of the muscle of Chaka sheep.
kosfa-44-6-1305-g9
Fig. 9. The heat map for clustering analysis of differential lipid molecules. BF, biceps femoris; LD, longissimus dorsi; PM, psoas major.
Download Original Figure

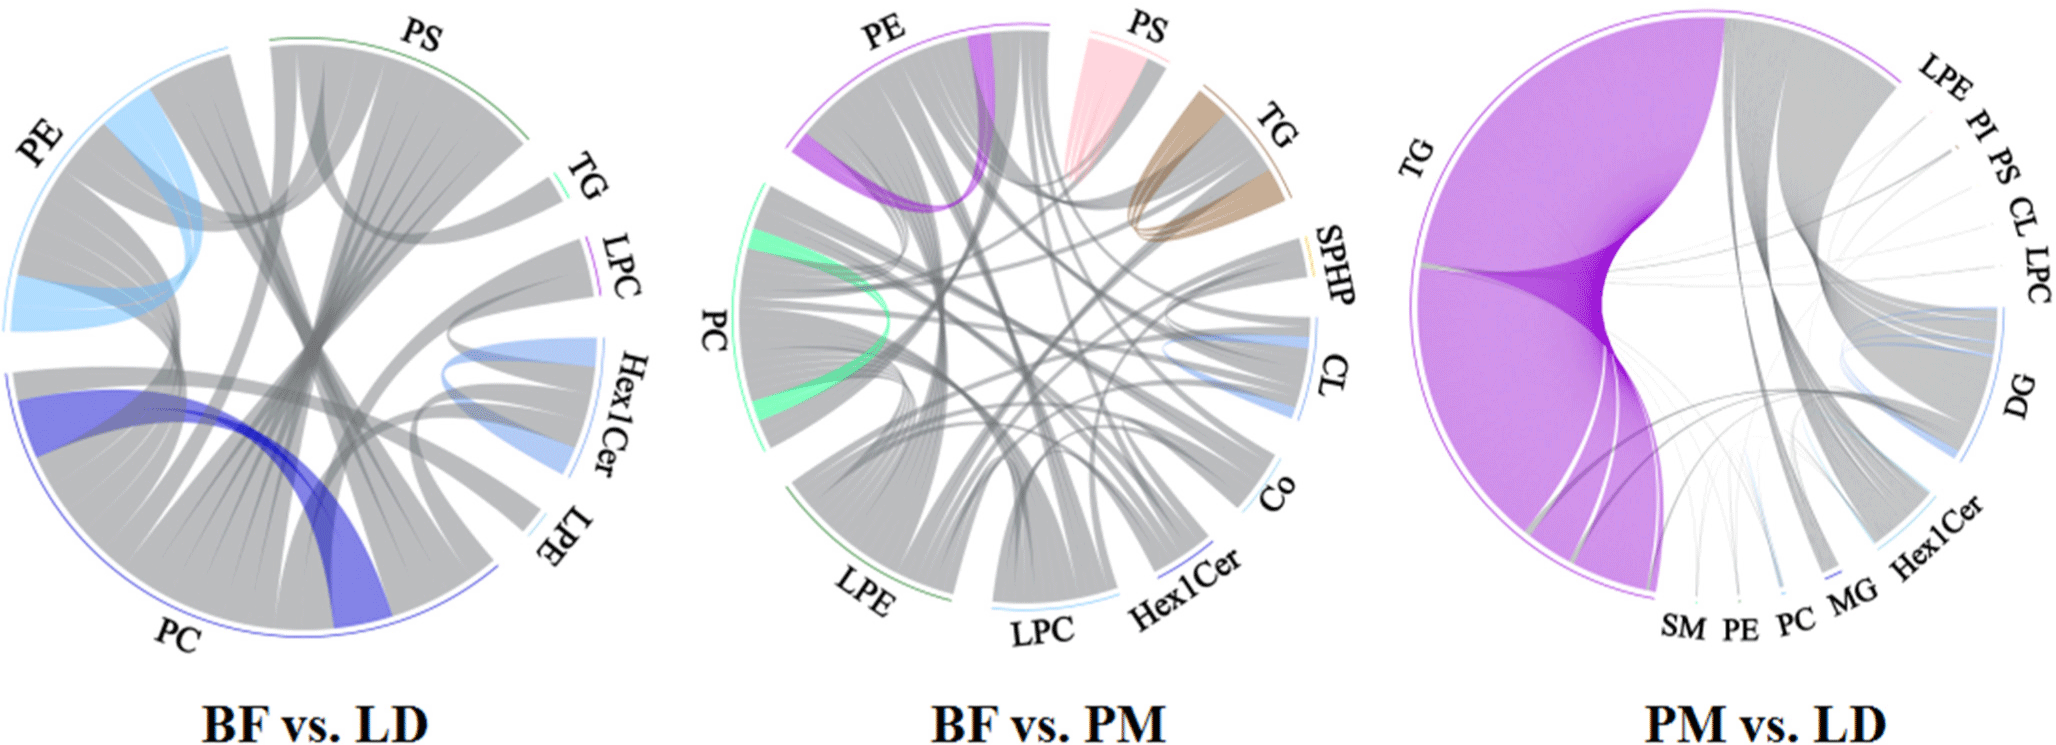
To show the relationship of lipid coregulation more intuitively, the chord diagram (Fig. 10) was utilized to show the correlation between lipid sub-classes, where the beginning point of the link in the inner circle represented the significantly different lipid molecules, and the bows on the outer circles indicated the lipid sub-classes. In BF vs. LD, our study reflected a strong correlation within lipid subclasses PC, PE, and Hex1Cer. By comparing the BF group with the PM group, we obtained some intramolecular correlations of lipid subclasses such as PC, PE, PS, TG, and CL. By comparing PM and LD, our results suggested that there were strong intramolecular correlations between the glycerol ester lipid subclass molecules TG and DG.
kosfa-44-6-1305-g10
Fig. 10. The plot of the differential lipid molecule correlation analysis. BF, biceps femoris; LD, longissimus dorsi; PM, psoas major; PE, phosphatidylethanolamine; PS, phosphatidylserine; TG, triacylglycerol; LPC, lysophosphatidylcholine; LPE, lysophosphatidylethanolamine; CL, cardiolipid; PI, phosphatidylinositol; DG, diacylglycerol; PC, phosphatidylcholine; PE, phosphatidylethanolamine; SM, sphingomyelin.
Download Original Figure

McMaster’s study showed that the majority of PE is synthesized from ethanolamines, while PE is a choline source. After the synthesis of PE, it can be converted to PC via sequential methylation steps (McMaster, 2018), which further validates the correlation between PC and PE in this study. Zhou’s study found that there was a strong correlation between PS and PI (Zhou et al., 2021). Hou et al. (2020) found a correlation between the expression of PSs and PIs in subcutaneous adipose tissue. However in our study, we did not find a strong correlation between PI and other lipid molecules, the relevance of other lipid molecules needs to be further verified.

Conclusion

In our study, we found differences in the composition of nutrients and lipid profile in three parts of the muscles of the Chaka sheep. Specifically, the LD had the highest CP content and the highest levels of aspartic acid and histidine, the BF had the highest contents of glycine and proline, and the PM had the highest abundance of ω-6 PUFA, linoleic acid, and volatile flavor compounds. PLs were the predominant lipids, which accounted for almost half of the total lipids. The lipid profiles were different in the LD, PM and BF of the Chaka sheep. There were obvious intermolecular relationships between PC, PE, Hex1Cer, PS, TG, DG, and CL. This work is aimed at characterizing the nutritional composition and lipid profile of the Chaka sheep. Our findings may open new horizons in the utilization of the Chaka sheep for nutritional or biomedical products, thus enhancing the commercial value of these products.

Supplemenrary Materials

Supplementary Materials

kosfa-44-6-1305-suppl1.pdf

Conflicts of Interest

The authors declare no potential conflicts of interest.

Acknowledgements

This research was supported by the Chief Scientist Program of Qinghai Province (2024-SF-102), the Second Comprehensive Scientific Expedition to the Qinghai-Tibet Plateau (2019QZKK040104), and the Joint Special Project of Sanjiangyuan National Park (LHZX-2022-02).

Author Contributions

Conceptualization: Xu X. Data curation: Guo T, Zhang Q. Formal analysis: Wang X, Li N. Methodology: Wang Y, Wei L. Software: Xu X, Liu H. Validation: Hu L. Investigation: Xu S. Writing - original draft: Xu X. Writing - review & editing: Xu X, Guo T, Zhang Q, Liu H, Wang X, Li N, Wang Y, Wei L, Hu L, Xu S.

Ethics Approval

The animal procedures used in this study were performed according to the Guidelines for the Care and Use of Laboratory Animals in China. This study was approved by the Experimental Animal Use Ethics Committee of the Northwest Institute of Plateau Biology, CAS (Permit No. NWIPB20160302).

References

1.

Ayed C, Martins SIFS, Williamson AM, Guichard E. 2018; Understanding fat, proteins and saliva impact on aroma release from flavoured ice creams. Food Chem. 267:132-139

2.

Boselli E, Pacetti D, Curzi F, Frega NG. 2008; Determination of phospholipid molecular species in pork meat by high performance liquid chromatography-tandem mass spectrometry and evaporative light scattering detection. Meat Sci. 78:305-313

3.

Chen H, Cheng J, Cao X, Hu L, Huang Y, Lan X. 2019a Detecting copy number variation (CNV) marker related to growth trait of Chaka sheep used in molecular marker assisted selection breeding of Chaka sheep includes amplifying lysine methyltransferase 2D (KMT2D) gene and identifying. Northwest A&F University. Xianyang, China: .

4.

Chen H, Yang Z, Hu L, Lan X, Huang Y, Hu S. 2019b Detecting CNV marker of Chaka sheep BAG4 gene useful in molecular marker assisted selection breeding of Chaka sheep comprises e.g. using real-time fluorescent quantitative PCR, using genomic DNA of Chaka sheep. Northwest A&F University. Xianyang, China: .

5.

Cohen EH. 1971; Comparison of the official AOAC method with rapid methods for the analysis of moisture in meats. J Assoc Off Anal Chem. 54:1432-1435

6.

Dai Z, Feng M, Feng C, Zhu H, Chen Z, Guo B, Yan L. 2024; Effects of sex on meat quality traits, amino acid and fatty acid compositions, and plasma metabolome profiles in White King squabs. Poult Sci. 103:103524

7.

Dannenberger D, Nuernberg G, Nuernberg K, Will K, Schauer N, Schmicke M. 2017; Effects of diets supplemented with n-3 or n-6 PUFA on pig muscle lipid metabolites measured by non-targeted LC-MS lipidomic profiling. J Food Compos Anal. 56:47-54

8.

Dashdorj D, Amna T, Hwang I. 2015; Influence of specific taste-active components on meat flavor as affected by intrinsic and extrinsic factors: an overview. Eur Food Res Technol. 241:157-171

9.

Enser M, Scollan ND, Choi NJ, Kurt E, Hallett K, Wood JD. 1999; Effect of dietary lipid on the content of conjugated linoleic acid (CLA) in beef muscle. Anim Sci. 69:143-146

10.

Fernandez X, Monin G, Talmant A, Mourot J, Lebret B. 1999; Influence of intramuscular fat content on the quality of pig meat: 1. Composition of the lipid fraction and sensory characteristics of m. longissimus lumborum. Meat Sci. 53:59-65

11.

Frank D, Kaczmarska K, Paterson J, Piyasiri U, Warner R. 2017; Effect of marbling on volatile generation, oral breakdown and in mouth flavor release of grilled beef. Meat Sci. 133:61-68

12.

Fu Y, Cao S, Yang L, Li Z. 2022; Flavor formation based on lipid in meat and meat products: A review. J Food Biochem. 46e14439

13.

Gao H, Zhang Y, Liu K, Fan R, Li Q, Zhou Z. 2022; Dietary sodium butyrate and/or vitamin D3 supplementation alters growth performance, meat quality, chemical composition, and oxidative stability in broilers. Food Chem. 390:133138

14.

Ge Y, Gai K, Li Z, Chen Y, Wang L, Qi X, Sheng X, Xing K, Wang X, Xiao L, Ni H, Guo Y, Chen L, Sheng X. 2023; HPLC-QTRAP-MS-based metabolomics approach investigates the formation mechanisms of meat quality and flavor of Beijing You chicken. Food Chem X. 17:100550

15.

Guo D, Wan P, Liu J, Chen DW. 2021; Use of egg yolk phospholipids to boost the generation of the key odorants as well as maintain a lower level of acrylamide for vacuum fried French fries. Food Control. 121:107592

16.

Guo T, Wang X, Zhang Q, Wei L, Liu H, Zhao N, Hu L, Xu S. 2022; Comparative analysis of the composition of fatty acids and metabolites between Black Tibetan and Chaka sheep on the Qinghai-Tibet Plateau. Animals. 12:2745

17.

Haag M. 2003; Essential fatty acids and the brain. Can J Psychiat. 48:195-203

18.

Hazel JR, Williams EE. 1990; The role of alterations in membrane lipid composition in enabling physiological adaptation of organisms to their physical environment. Prog Lipid Res. 29:167-227

19.

He Y, Zhou M, Xia C, Xia Q, He J, Cao J, Pan D, Sun Y. 2020; Volatile flavor changes responding to heat stress-induced lipid oxidation in duck meat. Anim Sci J. 91e13461

20.

Hou B, Zhao Y, He P, Xu C, Ma P, Lam SM, Li B, Gil V, Shui G, Qiang G, Wee Liew C, Du G. 2020; Targeted lipidomics and transcriptomics profiling reveal the heterogeneity of visceral and subcutaneous white adipose tissue. Life Sci. 245:117352

21.

Huang Q, Dong K, Wang Q, Huang X, Wang G, An F, Luo Z, Luo P. 2022; Changes in volatile flavor of yak meat during oxidation based on multi-omics. Food Chem. 371:131103

22.

Jia W, Li R, Wu X, Liu S, Shi L. 2021; UHPLC-Q-Orbitrap HRMS-based quantitative lipidomics reveals the chemical changes of phospholipids during thermal processing methods of tan sheep meat. Food Chem. 360:130153

23.

Kohn TA, Anley MJ, Magwaza SN, Adamson L, Hoffman LC, Brand TS. 2023; Muscle fiber type and metabolic profiles of four muscles from the African black ostrich. Meat Sci. 200:109156

24.

Li J, Yang Y, Tang C, Yue S, Zhao Q, Li F, Zhang J. 2022a; Changes in lipids and aroma compounds in intramuscular fat from Hu sheep. Food Chem. 383:132611

25.

Li J, Yang Y, Zhan T, Zhao Q, Zhang J, Ao X, He J, Zhou Q, Tang C. 2021; Effect of slaughter weight on carcass characteristics, meat quality, and lipidomics profiling in longissimus thoracis of finishing pigs. LWT-Food Sci Technol. 140:110705

26.

Li M, Ren W, Chai W, Zhu M, Man L, Zhan Y, Qin H, Sun M, Liu J, Zhang D, Wang Y, Wang T, Shi X, Wang C. 2022b; Comparing the profiles of raw and cooked donkey meat by metabonomics and lipidomics assessment. Front Nutr. 9:851761

27.

Liang Y, Jiao D, Du X, Zhou J, Degen AA, Ran F, Sun G, Ji K, Wu X, Cheng X, Ma X, Qian C, Yang G. 2023; Effect of dietary Agriophyllum squarrosum on average daily gain, meat quality and muscle fatty acids in growing tan lambs. Meat Sci. 201:109195

28.

Lin Y, Wang H, Rao W, Cui Y, Dai Z, Shen Q. 2019; Structural characteristics of dietary fiber (Vigna radiata L. hull) and its inhibitory effect on phospholipid digestion as an additive in fish floss. Food Control. 98:74-81

29.

Liu Z, Zhao M, Wang X, Li C, Liu Z, Shen X, Zhou D. 2022; Investigation of oyster Crassostrea gigas lipid profile from three sea areas of China based on non-targeted lipidomics for their geographic region traceability. Food Chem. 386:132748

30.

Lugo Charriez K, Soledade Lemos L, Carrazana Y, Rodriguez-Casariego JA, Eirin-Lopez JM, Hauser-Davis RA, Gardinali P, Quinete N. 2021; Application of an improved chloroform-free lipid extraction method to staghorn coral (Acropora cervicornis) lipidomics assessments. Bull Environ Contam Toxicol. 107:92-99

31.

Ma C, Li X, Zheng C, Zhou B, Xu C, Xia T. 2021; Comparison of characteristic components in tea-leaves fermented by Aspergillus pallidofulvus PT-3, Aspergillus sesamicola PT-4 and Penicillium manginii PT-5 using LC-MS metabolomics and HPLC analysis. Food Chem. 350:129228

32.

McMaster CR. 2018; From yeast to humans: Roles of the Kennedy pathway for phosphatidylcholine synthesis. FEBS Lett. 592:1256-1272

33.

Mohanty TR, Park KM, Pramod AB, Kim JH, Choe HS, Hwang IH. 2010; Molecular and biological factors affecting skeletal muscle cells after slaughtering and their impact on meat quality: A mini-review. J Muscle Foods. 21:51-78

34.

Oh R. 2005; Practical applications of fish oil (Ω-3 fatty acids) in primary care. J Am Board Fam Pract. 18:28-36

35.

Qin X, Zhang T, Cao Y, Deng B, Zhang J, Zhao J. 2020; Effects of dietary sea buckthorn pomace supplementation on skeletal muscle mass and meat quality in lambs. Meat Sci. 166:108141

36.

Ramos LMG, Bezerra LR, de Oliveira JPF, de Souza MP, da Silva AL, Pereira ES, Mazzetto SE, Pereira Filho JM, Oliveira RL. 2021; Effects of feeding growing-finishing lambs with cashew nut shell liquid on the growth performance, physicochemical attributes, lipid peroxidation and sensorial parameters of burger. Small Rumin Res. 202:106468

37.

Ribeiro de Araújo Cordeiro AR, de Medeiros LL, Alencar Bezerra TK, Bertoldo Pacheco MT, Galvão MS, Madruga MS. 2020; Effects of thermal processing on the flavor molecules of goat by-product hydrolysates. Food Res Int. 138:109758

38.

Roy BC, Coleman P, Markowsky M, Wang K, She Y, Richard C, Proctor SD, Bruce HL. 2024; Muscle fiber, connective tissue and meat quality characteristics of pork from low birth weight pigs as affected by diet-induced increased fat absorption and preferential muscle marbling. Food Sci Anim Resour. 44:51-73

39.

Schiavon S, Pellattiero E, Cecchinato A, Tagliapietra F, Dannenberger D, Nuernberg K, Bittante G. 2016; The influence of different sample preparation procedures on the determination of fatty acid profiles of beef subcutaneous fat, liver and muscle by gas chromatography. J Food Compos Anal. 50:10-18

40.

Simopoulos AP. 2008; The importance of the omega-6/omega-3 fatty acid ratio in cardiovascular disease and other chronic diseases. Exp Biol Med. 233:674-688

41.

Sun N, Chen J, Wang D, Lin S. 2018; Advance in food-derived phospholipids: Sources, molecular species and structure as well as their biological activities. Trends Food Sci Technol. 80:199-211

42.

Tang J, Zhang B, Liu D, Gao K, Dai Y, Liang S, Cai W, Li Z, Guo Z, Hu J, Zhou Z, Xie M, Hou S. 2023; Dietary riboflavin supplementation improves meat quality, antioxidant capacity, fatty acid composition, lipidomic, volatilomic, and proteomic profiles of breast muscle in Pekin ducks. Food Chem X. 19:100799

43.

Tian Y, Xu T, Li Y, Liu Y, Liu J. 2021; An untargeted LC-MS metabolomics approach to the metabolic profiles of bottom cultured scallops (Mizuhopecten yessoensis) subjected to mechanical shock in early post-harvest handling. Aquaculture. 533:736061

44.

Vahmani P, Ponnampalam EN, Kraft J, Mapiye C, Bermingham EN, Watkins PJ, Proctor SD, Dugan MER. 2020; Bioactivity and health effects of ruminant meat lipids. Invited review. Meat Sci. 165:108114

45.

Varlet V, Prost C, Serot T. 2007; Volatile aldehydes in smoked fish: Analysis methods, occurrence and mechanisms of formation. Food Chem. 105:1536-1556

46.

Wang DY, Zhu YZ, Xu WM. 2009; Comparative study of intramuscular phospholipid molecular species in traditional Chinese duck meat products. Asian-Australas J Anim Sci. 22:1441-1446

47.

Xu X, Liu H, Wang X, Zhang Q, Guo T, Hu L, Xu S. 2023; Evaluation of the Longissimus thoracis et Lumborum muscle quality of Chaka and Tibetan sheep and the analysis of possible mechanisms regulating meat quality. Animals. 13:2494

48.

Yang Z, Hou Y, Zhang M, Hou P, Liu C, Dou L, Chen X, Zhao L, Su L, Jin Y. 2024; Unraveling proteome changes of Sunit lamb meat in different feeding regimes and its relationship to flavor analyzed by TMT-labeled quantitative proteomic. Food Chem. 437:137657

49.

Yin M, Chen M, Matsuoka R, Song X, Xi Y, Zhang L, Wang X. 2023; UHPLC-Q-Exactive Orbitrap MS/MS based untargeted lipidomics reveals fatty acids and lipids profiles in different parts of capelin (Mallotus villosus). J Food Compos Anal. 116:105096

50.

Zhang X, Han L, Hou S, Raza SHA, Wang Z, Yang B, Sun S, Ding B, Gui L, Simal-Gandara J, Shukry M, Sayed SM, Al Hazani TMI. 2022a; Effects of different feeding regimes on muscle metabolism and its association with meat quality of Tibetan sheep. Food Chem. 374:131611

51.

Zhang Y, Rui X, Vaugeois R, Simpson BK. 2022b; Seal meat enzymatic hydrolysates and its digests: A comparison on protein and minerals profiles. LWT-Food Sci Technol. 157:113072

52.

Zhang Y, Zhang J, Gong H, Cui L, Zhang W, Ma J, Chen C, Ai H, Xiao S, Huang L, Yang B. 2019; Genetic correlation of fatty acid composition with growth, carcass, fat deposition and meat quality traits based on GWAS data in six pig populations. Meat Sci. 150:47-55

53.

Zhou J, Zhang Y, Wu J, Qiao M, Xu Z, Peng X, Mei S. 2021; Proteomic and lipidomic analyses reveal saturated fatty acids, phosphatidylinositol, phosphatidylserine, and associated proteins contributing to intramuscular fat deposition. J Proteomics. 241:104235

54.

Zhou L, Khalil A, Bindler F, Zhao M, Marcic C, Ennahar S, Marchioni E. 2013; Effect of heat treatment on the content of individual phospholipids in coffee beans. Food Chem. 141:3846-3850

55.

Zhou L, Zhao M, Bindler F, Marchioni E. 2014; Comparison of the volatiles formed by oxidation of phosphatidylcholine to triglyceride in model systems. J Agric Food Chem. 62:8295-8301

56.

Zuo H, Han L, Yu Q, Niu K, Zhao S, Shi H. 2016; Proteome changes on water-holding capacity of yak longissimus lumborum during postmortem aging. Meat Sci. 121:409-419