Introduction
In recent years, there is an increasing interest in pet food with the growing awareness of the pet industry (Baek and Kim, 2024; Prata, 2022). There are several types of pet food, including dry pet food, semi-moist pet food, wet pet food, etc. (Carrión, 2023). Among them, dry pet food is the most convenient type for pet owners because its low moisture content prevents mold or bacteria growth, facilitating storage (Morelli et al., 2021). In addition, dry pet food has the advantage of being inexpensive because it is easy to mass-produce.
Generally, dry pet food is stored at room temperature, and it is recommended to be stored in a dry and cool place. However, buying dry pet food in bulk can lead to longer consumption periods, exposing it to various factors that may affect its quality. Once the package is opened, it cannot remain fresh due to exposure to air. For example, the humid and hot summer can make the food damp and moldy. According to a survey by Morelli et al. (2021), 23.6% of dry pet food consumers responded that stored feed could be unintentionally exposed to high temperatures. High-temperature storage promotes the oxidation of fat, which can lead to the formation of rancid flavor in dry pet food (Onilude et al., 2010; Robert et al., 1980).
Dry pet food typically contains grains such as corn, soy, oats, and barley, which have been exposed to soil microbes during growth and harvest (Scudamore and Livesey, 1998). The manufacturing process can kill microbes through high-temperature pellet extrusion (Gazzotti et al., 2015). However, post-manufacture packaging and distribution can allow for the multiplication of residual microbes (Scudamore and Livesey, 1998). It is leading to spoilage under proper conditions. Warm conditions, like in summer, accelerate microbial growth. Consuming contaminated feed can risk food poisoning to pets. Cases of acute or chronic aflatoxicosis caused by contaminated feed have been consistently reported to harm the health of pets (Crump et al., 2002).
The recommended storage condition of dry pet food is only stated as a cool, dry, well-ventilated place away from direct sunlight. General room temperature is 25°C, however, in Korea, the year consists of four different seasons (spring, summer, autumn, and winter) with a large variation in temperature and humidity between them. And especially in summer, it gets quite humid and hot. The temperature often rises above 35°C. Such differences can vary the quality of food stored at room temperature, like dry pet food, so its changes should be studied carefully considering the actual conditions in Korea. In addition, most of the dry pet food is stored opened at home. Therefore, in order to determine the safety and stability of the opened feed, it is necessary to check the changes in microorganisms and the quality of the feed according to the storage conditions. For these reasons, this study attempted to study changes over time in microorganisms and quality while exposing the dry pet food to the air at different storage temperatures.
Materials and Methods
The extruded kibble-type of dry pet food (10 mm in diameter) was provided by ATbio (Namyangju, Korea). The ingredients we used in the dry pet food included duck powder, chicken powder, salmon powder, salmon oil, soybean meal, tapioca starch, beet pulp, parsley, yucca extract, flaxseed, fructooligosaccharides, astaxanthin, vitamins (A, B12, D, and E), and minerals (calcium, iron, and zinc). After mixing and grinding the ingredients, the mixture was extruded by heating it to above 70°C for more than 30 seconds at a motor speed of 60 Hz. Table 1 shows the the proximate composition of the tested dry pet food.
| Items | Percentage (%) |
|---|---|
| Moisture | 18.41 |
| Crude protein | 29.87 |
| Crude fat | 19.33 |
| Crude fiber | 1.70 |
| Crude ash | 6.69 |
| Calcium | 1.59 |
| Phosphorous | 0.95 |
The samples (approximately 100 g) were packaged in plastic film bags without sealing to simulate the actual storage condition of dry pet food. The packaged samples were divided into two different groups [25°C and 35°C (D25 and D35, respectively)], considering the weather conditions in Korea, and stored for 120 days. During the storage, RH was monitored as 40%. Then, the samples were collected at 30-day intervals to analyze microorganisms and quality during storage days. Microorganisms, water content, water activity, color, and pH were analyzed right after the samples were collected each storage day. The samples for 2-thiobarbituric acid reactive substance (TBARS) and volatile basic nitrogen (VBN) analysis were stored at –80°C and were tested together at a later time.
The water content measurements were performed according to the analytical methods of the AOAC International (AOAC, 2019). The minced sample (3 g) was spread on a dish and weighed. The dish containing the sample was dried in a drying oven at 105°C for 16 hrs (DS-520L, Daewon Science, Bucheon, Korea). The water content was obtained by calculating the weight loss of the sample after drying.
The pH was measured according to the method described in Jung et al. (2022). The sample (1 g) and 9 mL of distilled deionized water (DDW) was homogenized with the mechanical homogenizer (T25 basic, IKA Works, Staufen, Germany) at 9,600 rpm for 30 seconds. After centrifuging the homogenate at 2,265×g (Continent 512R, Hanil, Incheon, Korea), the supernatant was filtered through a filter paper (Whatman No.1, Whatman Plc, Maidstone, UK). Then the pH was measured using a pH meter (Seven2GO, Mettler-Toledo, Schwerzenbach, Switzerland) after calibration in standard solutions with pH of 4.01, 7.00, and 9.21, respectively.
To measure the water activity of the dry pet food, we used a water activity meter (HygroPalm HP23-AW-A, Rotronic, Bassersdorf, Switzerland). The sample cup was filled with 3 g of intact samples without grinding. Then, it was mounted on the machine, adjusting the mode of the machine to the measurement, and the measurement start button was pressed. When the notification sound that it has stabilized, the value was read and recorded.
For microbial analysis, total aerobic bacteria (TAB) and yeasts and molds (YM) were analyzed. First, 25 g of the intact samples and 225 mL of 0.85% sodium chloride were transferred to a sterile Whirl-Pak bags (Nasco, Fort Atkinson, WI, USA). Then, they were blended using a stomacher (BagMixer400P, Interscience, Saint-Nom-la-Bretèche, France) for 2 min. The resulting solution was serially diluted, and each dilution was spread on plate count agar (PCA; Difco, Becton Dickinson, Sparks, MD, USA) and potato dextrose agar (PDA; Difco, Becton Dickinson). Before enumeration, the PCA and PDA plates were incubated at 37°C for 48 hours and 25°C for 120 hours, respectively. Colonies found in the PCA plates were to be counted as TAB, and those found in PDA plates were to be counted as YM. The number of microorganisms counted was to be expressed as CFU/g.
A colorimeter (CM-5, Konica Minolta, Osaka, Japan) with an 8 mm measuring port was used to measure the color of the dry pet food sample. The colorimeter was calibrated using standard black and white calibration plates (CM-5, Konica Minolta). A sample of 10 g was placed on the measuring port and the thickness was kept constant at 20 mm. The color of the sample was expressed as CIE color L*, a*, and b* which mean lightness, redness, and yellowness, respectively. The mean of five measurements was recorded for different parts of each sample.
The TBARS value was determined using the methods described by Shin et al. (2022). First of all, 15 mL of DDW and 50 μL of 7.2% 2,6-Di-terti-butyl-4-methyl-phenol in ethanol were added to 5 g of the minced sample. Then, they were homogenized at 9,600 rpm (T25 basic, IKA Works) for 30 seconds. After centrifuging the homogenate at 2,265×g (Continent 512R, Hanil), the supernatant was filtered through filter paper (Whatman No.4, Whatman Plc). The filtrated solution (1 mL) was then transferred to a new tube, and 2 mL of 20 mM thiobarbituric acid in 15% trichloroacetic acid was added. After heating them in 90°C of water bath for 30 minutes, the samples were cooled, vortexed, and centrifuged at 2,265×g for 15 minutes (Continent 512R, Hanil). The absorbance of the supernatant solution was evaluated at 532 nm using a spectrophotometer (M23, Molecular Devices, San Jose, CA, USA). TBARS value were expressed as mg of malondialdehyde (MDA) per kg of the dry pet food. The calculation was carried out using the coefficients obtained from the standard curve.
The VBN value was determined using the Conway’s micro-diffusion method (Conway, 1948). Dry pet food (3 g) and DDW (27 mL) were homogenized at 9,600 rpm for 30 seconds (T25 basic, IKA Works). After centrifuging the homogenate at 2,265×g (Continent 512R, Hanil), the supernatant was filtered through filter paper (Whatman No.1, Whatman Plc). The filtrated solution (1 mL) was added to the outer part of a Conway micro-diffusion cell. To the center part of the cell, 0.01 N boric acid (1 mL) and 100 μL of indicator was added. The indicator is 1:1 mixture of 0.066% methyl red and 0.066% bromocresol green in ethanol. Then, after adding 1 mL of 50 % potassium carbonate to the another side of the outer cell, the cell was immediately covered and incubated for 2 hours at 37°C. After incubation, the inner cell was titrated with 0.01 N hydrochloric acid (HCl). The VBN value was calculated as follows.
Where: V0 is the volume of 0.01 N HCl (mL) added in the blank, V1 is the volume of 0.01 N HCl (mL) added in the sample, and d is the dilution factor.
This study was conducted with three replications (n=3). Statistical analysis was performed using SAS software (SAS, Release 9.4; SAS Institute, Cary, NC, USA). All data were assessed using analysis of variance (one-way ANOVA). To compare the mean value of each day, a significance test was performed at the p<0.05 level using the Tukey’s multiple comparison test.
Results and Discussion
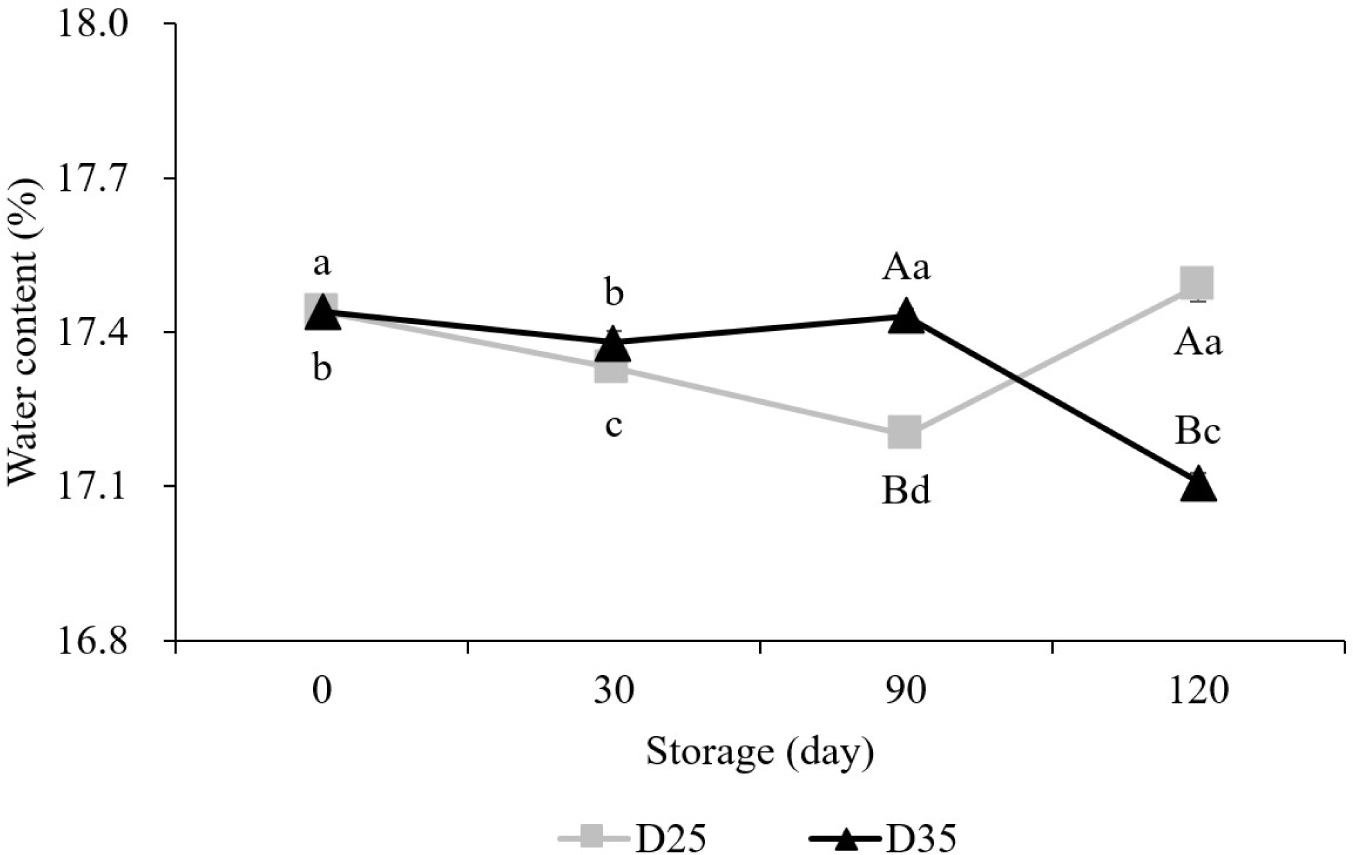
During 120 days of storage period, slightly different changes in the water content were observed between D25 and D35 (Fig. 1). D25 decreased its water content until day 90 and increased thereafter, while that in D35 was tended to decrease, except for day 90 (p<0.05). Due to the different changes, D35 showed lower water content than D25 on day 120 (17.1% and 17.5%, respectively). This result shows that the water content tended to decrease at the higher temperature. Similar to our study, the study of Paraginski et al. (2014) showed the lowest water content when corn was stored at the highest temperature. However, in our study, the differences between D25 and D35 were actually very small, at 0.4%. Therefore, changes in the water content of the dry pet food might be negligible regardless of storage temperatures.

The pH change can represent food deterioration (Roy and Rhim, 2021). When dry pet food was stored under different storage temperature, their pH value was decreased in both groups with different manners (Table 2). The faster decrease was observed in D35 compared to D25. A prior study has also confirmed that the higher the storage temperature, the higher the decrease in pH value (Jung et al., 2015). The pH of both D25 and D35 showed a decreasing trend (p<0.05) with different rates of decease, but the changes in pH were negligibly small during the 4 months of storage (Table 2). Reduction of pH during food storage is mainly due to microbial fermentation (Tang et al., 2016). However, we did not detect any microorganisms grown in the dry pet food. Dry pet food is formulated to have low moisture content, inhibiting microbial metabolism and enzymatic reactions that could contribute to pH changes (Rezaei and Vandergheynst, 2010). Instead, we found that high temperatures can change the structure of proteins in food, which can lead to a drop in the pH of food (Masson and Lushchekina, 2022). Therefore, we speculate that the reduction in pH may be due to protein denaturation. It has been reported that pH change can affect taste, texture, color, and nutritional value of food (Andrés-Bello et al., 2013). For example, the pH of fried rice dropped significantly from 8.19 to 5.80 after 5 weeks at 25°C, but only decreased from 8.19 to 6.81 at 4°C, and these differences in storage temperatures were shown to affect sensory preference (Jung et al., 2015). However, in this study, the pH changes after 4 months in D25 and D35 are from 6.26 to 6.22 and from 6.26 to 6.20, respectively. Therefore, the pH reduction under both conditions is practically insignificant.
| Treatment | Storage (day) | SEM1) | |||
|---|---|---|---|---|---|
| 0 | 30 | 90 | 120 | ||
| D25 | 6.26a | 6.25ab | 6.22Abc | 6.22c | 0.006 |
| D35 | 6.26a | 6.25a | 6.20Bb | 6.20b | 0.006 |
| SEM2) | 0.011 | 0.003 | 0.002 | 0.004 | |
Water activity represents the availability of water for biochemical reactions. It is expressed as the ratio of the vapor pressure in a substance to the vapor pressure of pure water (Mathlouthi, 2001). The effect of water activity on food quality is important. For example, when the water activity is 0.80 or higher, fungi easily occur in food (Leistner, 2000). On the other hand, as the water activity value decrease below the monolayer of water (about 0.30), the lipid oxidation rate increases, which negatively affects the quality of food (Nelson and Labuza, 1992).
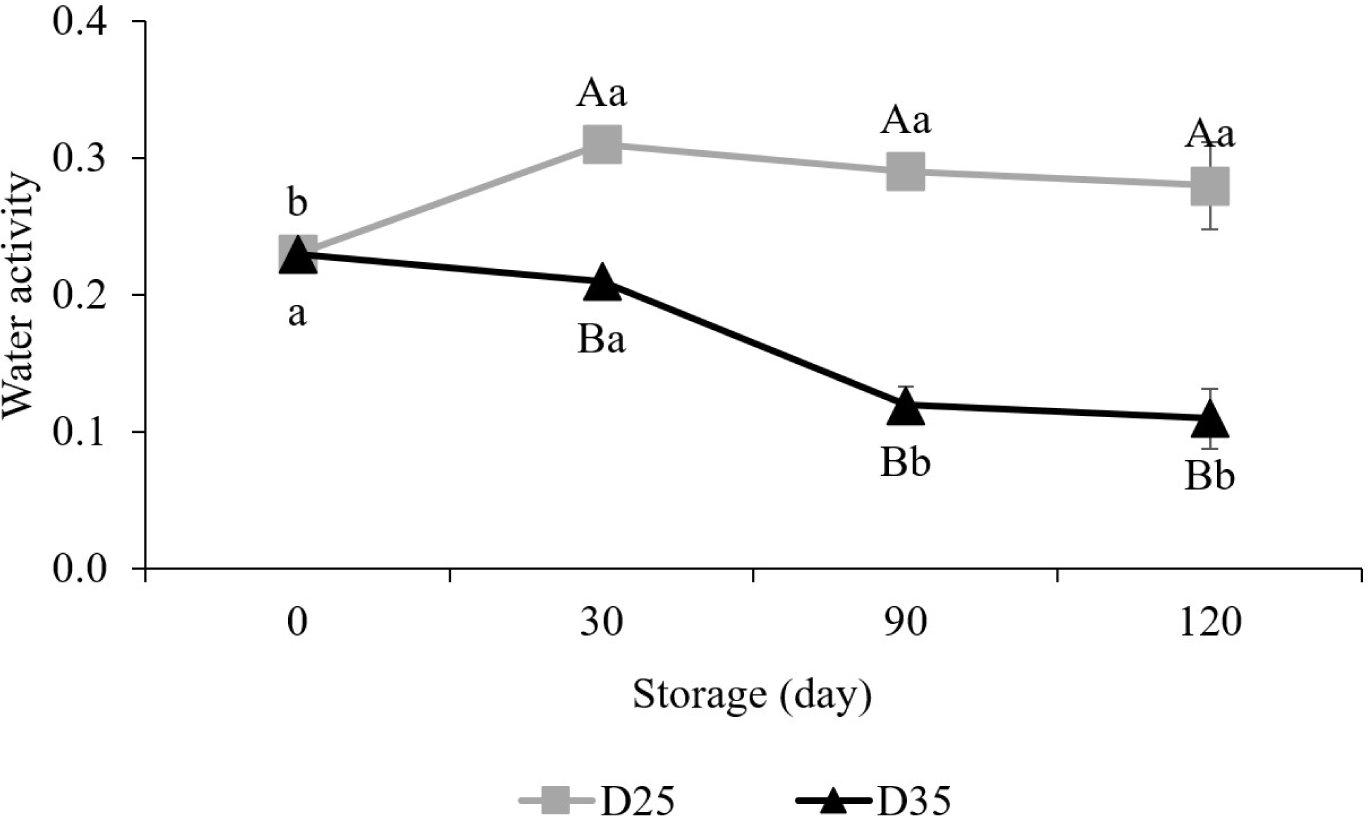
In the dry pet food, their water activity was 0.23 on day 0 (Fig. 2). However, after 120 days of storage, it was significantly increased in D25 (0.28), whereas D35 (0.11) decreased (p<0.05). This is because the higher temperatures boost the kinetic energy of water molecules, making it easier for them to transition from liquid to a vapor state and reducing water activity (Labuza et al., 1985). But anyway, throughout the experimental period, the water activity range of the dry pet food indicated that the microorganisms could not survive, rather it was close to the value that could easily cause lipid oxidation (Gumus and Decker, 2021).

Regardless of different storage conditions, both TAB and YM were not detected in the dry pet food until 120 days of storage. For the growth of microorganisms, it requires conditions such as temperature, moisture, pH, and nutritional sources, and it is difficult to grow well if any of them is lacking (Dixon, 2012). For example, water that is not attached to food molecules supports the growth of bacteria, yeasts, and molds. Water activity refers to this unbound water (Ghaly et al., 2010). It has been reported that most bacteria cannot be grown if water activity is below 0.91 (Beuchat, 1983; Sperber, 1983), and most molds cannot survive if it is below 0.80 (Leistner, 2000). In this study, the water activity was ranged from 0.11 to 0.28, which are lower than possible level for the growth of TAB and YM. Therefore, even at 35°C, a better temperature for most bacteria to grow, microorganisms could not survive because of their extremely low water activity.
On the other hand, these results could also be attributed to enough sterilization during the sample production process. Tran (2008) notes that the pet food industry primarily manufactures dry pet food using an extrusion process, which effectively sterilizes the food through high-temperature and high-pressure treatment. But the main reason why microorganisms were not detected even after exposing the sample to the outside air is thought to be due to the low water activity at which microorganisms cannot survive.
In general, the color of food is one of the sensory characteristics and is the standard for guessing the product value, deterioration, freshness, and storage period of food (Lee and Shin, 2019). Table 3 shows the change of color of dry pet food during 120 days at 25°C and 35°C. After 120 days of storage, under both D25 and D35 conditions, CIE L* values were decreased significantly, while CIE a* values and CIE b* values were increased significantly. By day 120, storage temperature notably affected the CIE L* values and CIE b* values, with no significant impact on the CIE a* values. From the 90th day of storage, the CIE L* value significantly differed between temperatures, with D35 being lower than D25. In the case of the CIE a* value, D35 was significantly higher on day 30, but by day 90, D25 had caught up, showing no significant difference from D35. For the CIE b* value, D35 showed a significant increase compared to D25 on day 30, and then fluctuated within a similar value. The increase in CIE a* value and CIE b* value is likely due to the Maillard reaction of reducing sugars and amino acids (Li et al., 2020). According to a study by Stapelfeldt et al. (1997), the Hunter b-value of the milk powder increased over the storage period due to the browning caused by the Maillard reaction. In addition, Mouhoubi-Tafinine et al. (2018) found a significant increase in the hydroxymethyl furfural content, the product of the Maillard reaction, only at storage temperatures above 30°C. The decrease in brightness (CIE L* value) would be attributed to the pigment produced by the Maillard reaction, which is associated with an increase in CIE a* and CIE b* (Cai et al., 2016; Tan et al., 2021). When these results are put together, it can be judged that the color of the dry pet food sample has changed significantly due to the high storage temperature and the lapse of the storage period. This also mean that long storage and high temperature storage induce deterioration of feed.
On the other hand, assessing pet food quality based on color is not effective because each pet food product has unique characteristics and ingredients. Moreover, dogs, the primary consumers of pet food, rely more on smell than color (Landsberg et al., 2011). They have a limited color perception compared to humans, only able to see yellow and blue, due to having fewer types of cone cells in their eyes (Barber et al., 2020; Byosiere et al., 2018). Therefore, from a dog’s perspective as a consumer, the quality of the feed cannot be determined by identifying the difference in color.
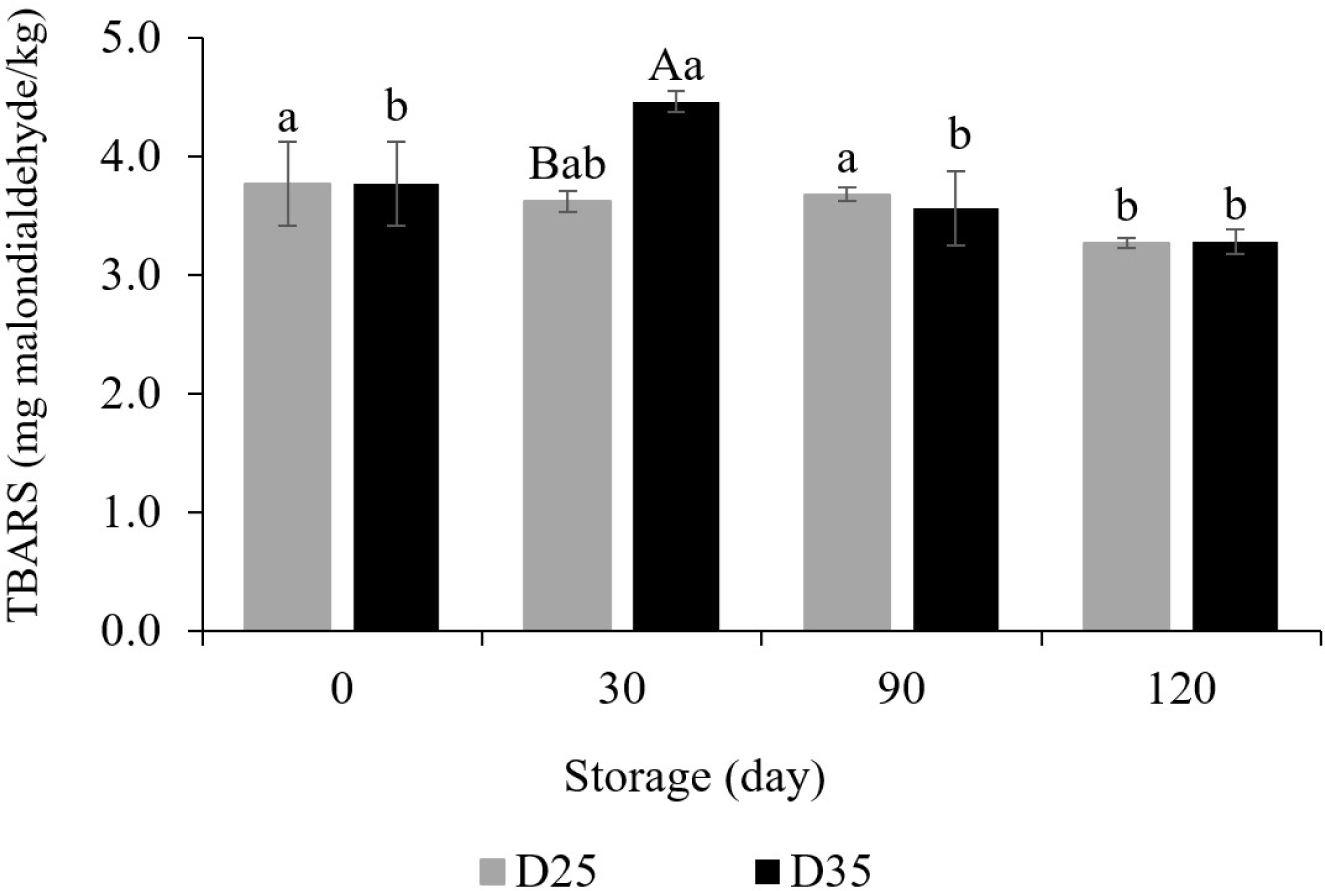
MDA is produced due to lipid oxidation and color reaction with thiobarbituric acid is carried out. The more severe the degree of lipid oxidation, they produce a red-pink color, and the higher the TBARS value (Ohkawa et al., 1979). Fig. 3 shows the change of TBARS value of dry pet food during 120 days at 25°C and 35°C. The initial value was 3.77 mg MDA/kg. On the 30th day of storage, D35 (4.46 mg MDA/kg) had the higher value than D25 (3.62 mg MDA/kg). Consistent with our predictions, the temperature-dependent relationship with chemical reactions resulted in enhanced lipid oxidation at higher temperatures (Silbey et al., 2022). In a similar case, Liu et al. (2019) had reported that higher temperatures further promote lipid oxidation in peanuts. Unusually, however, there was no difference due to storage temperature from day 90. This may be attributed to the antioxidants included in the dry pet food. Some ingredients, such as salmon oil, flaxseed, parsley, vitamin E, and astaxanthin, possess antioxidative activities (King et al., 1992; Oliveira et al., 2018). They may inhibit the further progression of lipid oxidation during storage. In addition, after 120 days, the final values for D35 and D25 were 3.28 and 3.27 mg MDA/kg, respectively, showing a reduction of MDA content from the initial value. This decrease is seen as the loss of TBARS component due to Maillard reaction during storage. Because MDA tends to react with compounds produced by the Maillard reaction (Gómez-Sánchez et al., 1992). There are also previous studies showing that Maillard reaction products have antioxidant properties (Pischetsrieder et al., 1998; Yilmaz and Toledo, 2005). For these reasons, TBARS values can decrease if a Maillard reaction occurred during storage (Hernández et al., 2014). From the present study, we could conclude that 4 months of storage period did not affect the promotion of the lipid oxidation of the dry pet food.

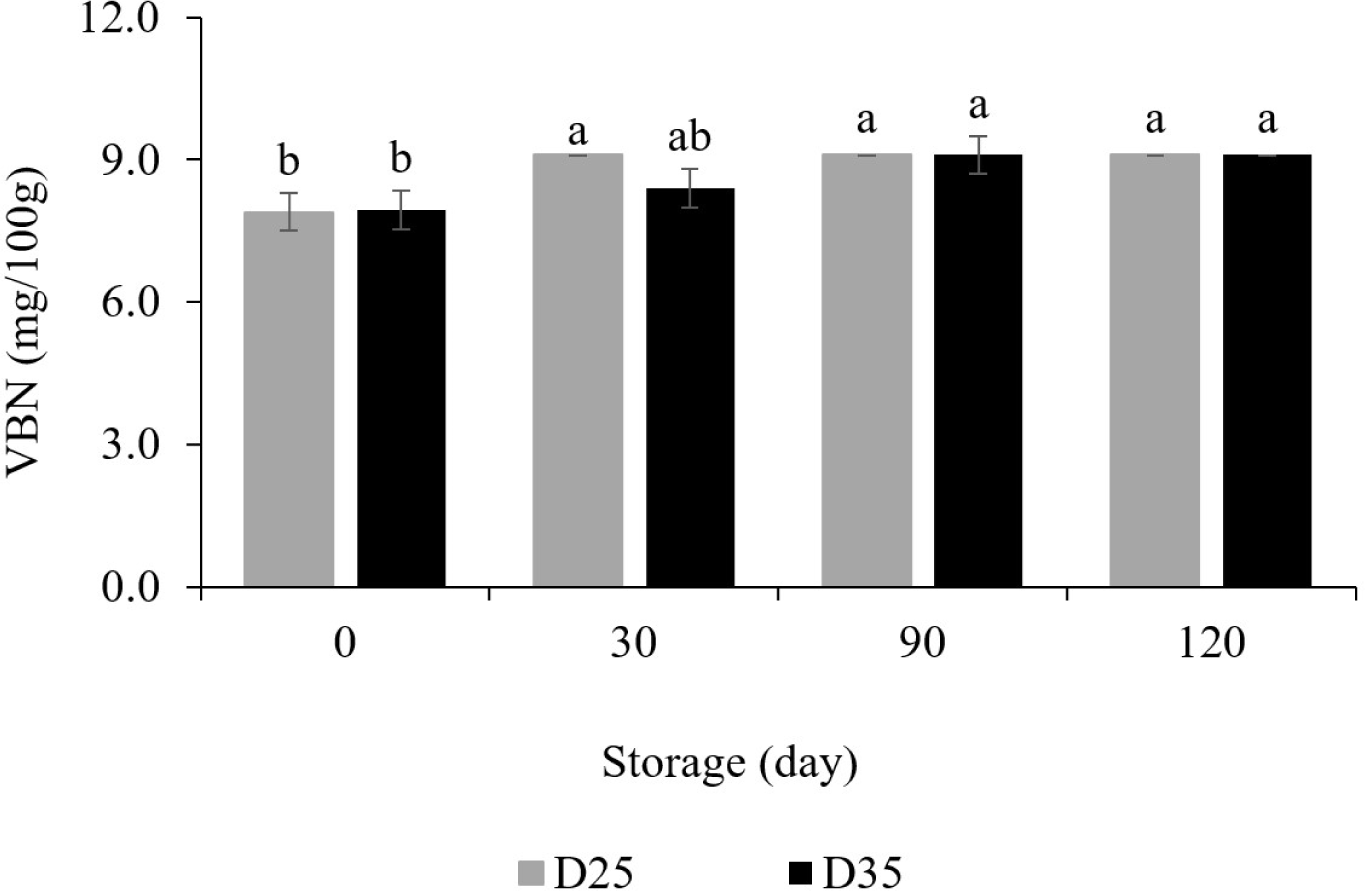
VBN is generated by the degradation of proteins and amines (Bekhit et al., 2021). Its formation pathway is mainly related to the activity of endogenous enzymes and contaminated bacteria (Kathuria et al., 2022). Fig. 4 shows the change of VBN of dry pet food during 120 days at 25°C and 35°C. The initial value was 7.9 mg/100 g. From the 90th day of storage, both D25 and D35 showed an increase of 1.2 mg/100 g and the same value was maintained at 120 days. Since no microorganisms have been found in this study, it is difficult to say that it is an increase caused by bacteria. But this could be attributed to protein degradation caused by endogenous enzyme remaining in the dry pet food (Holman et al., 2021). Anyway, it was a very small increase and showed a stable level that did not reach the standard of 20 mg/100 g for decay. Therefore, it can be concluded that the dry pet food sample was not decomposed overall regardless of the storage temperature and period.

Conclusion
For 120 days, no microorganisms were detected from the dry pet food at both 25°C and 35°C storage temperatures. Due to very low water activity, the quality characteristics such as pH, TBARS, and VBN changed very slightly. Therefore, we conclude that dry pet food can be store at room temperature or up to 35°C for 4 months without compromising its quality.


