Introduction
The freshness of muscle food, especially fish, is vital because it influences consumer purchasing decisions. Fish are prone to quality deterioration owing to the rapid degradation of muscle tissues during the post-mortem period during (Hashimoto et al., 2017). Deterioration of fish quality results in organoleptic changes, such as discoloration and off-flavors, making it undesirable for human consumption. The freshness of fish is difficult to sustain for a longer period because of the high moisture and lipid contents, rapid enzymatic activity, neutral pH, and high microbial proteolysis in fish (Prabhakar et al., 2020; Zhou et al., 2021). Proteolytic activity in fish is affected by several factors such as temperature, muscle pH, water content, genetics, nutrition, age, and gender (Matarneh et al., 2017; Singh and Benjakul, 2018).
Among storage methods, freezing is the preferred technique to maintain quality for extended preservation of fish freshness because low temperatures slow down proteolysis and endogenous enzyme activities in muscle food (Chan et al., 2020; Roiha et al., 2018). Thus, the freezing method protects fish tissues from rapid degradation by biological, chemical, and physical processes, such as bacterial growth, oxidation, and dehydration, maintaining their flavor and nutritional value (Duarte et al., 2020; Hassoun et al., 2020; Huang et al., 2021). In contrast, high freezing temperatures trigger proteolytic enzyme activities, decreasing the tenderness and increasing the spoilage of fish (Kaur et al., 2021). High ambient storage temperature (10°C–25°C) results in rapid degradation of fish quality compared to freezing and refrigerating conditions (Chen et al., 2021; Khoshnoudi-Nia and Moosavi-Nasab, 2019). Ice chilling is the traditional method of storage at low temperatures. However, this is not practically applied in the supply chain and long term storage, because the introduction of cooling technology and the use of ice incurs extra costs for controlling the storage temperature (Cropotova et al., 2019; Magnussen et al., 2008). Therefore, the impact of various storage conditions on the thorough information of quality and shelf life of fish should be assessed.
Hyperspectral imaging (HSI) has been introduced in food quality evaluation to replace conventional methods, which are time-consuming, expensive, and susceptible to large sources of variation (Hassoun and Karoui, 2017). HSI is a non-destructive spectral method with effective and accurate quality detection abilities (Wu et al., 2018). It extracts spectral and spatial information by absorbing, transmitting, reflecting, and scattering images of food products (Cheng et al., 2017). HSI acquires information on the quality of fishery products in each pixel from different locations without affecting sample integrity (Chen et al., 2021; Govari et al., 2021; Khoshnoudi-Nia and Moosavi-Nasab, 2019; Moosavi-Nasab et al., 2021; Temiz and Ulaş, 2021). However, none of the studies conducted thoroughly compared the physical, chemical, and biological characteristics of fish fillets using the HSI tool. This study aimed to compare the quality changes in mackerel fillets stored under different conditions using conventional and HSI techniques to investigate the potential of HSI for rapid prediction of physicochemical traits in fish. By incorporating fundamental HSI processing, valuable insights can be gained to practically implement in the short-chain supply before reaching consumers.
Materials and Methods
A total of 96 live chub mackerels (Scombus japonicus), typically ranging in size from 23 to 35 cm and weighing around 200 to 300 g, with approximately 24 months of age, were purchased from the fish market in Incheon, Korea, and transferred to the laboratory. Chub mackerel was chosen because it is a good source of omega-3 fatty acids and is widely distributed in various regions, including the western Pacific Ocean, the eastern Atlantic Ocean, and the Mediterranean Sea. After stunning, the mackerels were filleted and stored at 4°C for 8 hours to allow rigor mortis to set in. Approximately 150 g of the sample was vacuumed and packaged (HFV-600L, Hankook Fujee Machinery, Hwaseong, Korea) in low-density polyethylene/nylon bags (0.09 mm thickness; O2 permeability of 2 mL/m2/d at 0°C; Sunkyung, Seoul, Korea). Mackerel fillets were stored for six days using five different methods: refrigerated at 4°C (R group); iced at 5±3°C (I group); kept at an ambient temperature of 17±2°C (A group); frozen at –18°C for 24 h and thawed in a refrigerator at 4°C for 5 h on the sampling day (FTR group); FTR thawed in tap water instead of in a refrigerator (FTW group). Each group had three replicates. Fillets were analyzed on days 1, 3, and 6 of storage. Approximately 10×5×3 cm fillets (n=6) were cut for HSI analysis in both sides, while the remaining fillets underwent immediate laboratory analysis or were ground and kept at –20°C until analysis.
One gram of each sample was homogenized with 9 mL distilled water using a homogenizer (Ultra-Turrax T25, Ika-Werke, Staufen, Germany) at 1,720×g for 30 s. The homogenates were centrifuged (Union 32R, Hanil, Seoul, Korea) at 2,265×g for 10 min and filtered (Whatman No. 4, Whatman plc, Maidstone, UK). The pH of each filtrate was measured using a pH meter (SevenGo, Mettler-Toledo, Schwerzenbach, Switzerland).
TBC was performed according to the ICMSF (1986) by aseptically transferring 10 g of the sample to a sterile bag containing 90 mL of saline solution. After mixing, serial dilutions (101 to 104 Log CFU/g) of the samples were prepared. Then, 100 μL aliquots of appropriate dilutions were spread on plate count agar, incubated at 37°C for 48–72 h, and then colonies were counted.
Protein oxidation was assessed based on the VBN value obtained using the Conway micro-diffusion technique (Conway, 1947). Three grams of sample was homogenized with 27 mL of distilled water using a homogenizer (Ultra-Turrax T25, Ika-Werke) at 1,720×g for 30 s. The homogenates were centrifuged (Union 32R, Hanil) at 2,265×g for 10 min and filtered (Whatman No. 1, Whatman plc). Subsequently, 1 mL each of the sample, 50% K2CO3, and 0.01N H3BO3 and 100 μL indicator (0.066% methyl red in ethanol: 0.066% bromocresol green in ethanol, 1:1, w/v) were poured into the Conway. Color changes were observed and recorded by adding 0.01 N HCl to the center of the Conway.
Lipid oxidation was measured using the TBARS assay following the process described by (Lee et al., 2016), with a slight modification. Five grams of sample were homogenized with 9 mL of distilled water and 50 μL of 2% tert-butyl-4-hydroxyanisole ethanol solution (BHT) using a homogenizer (Ultra-Turrax T25, Ika-Werke) at 1,720×g for 30 s. The homogenates were centrifuged (Union 32R, Hanil) at 2,265×g for 15 min and filtered (Whatman No. 1, Whatman plc). The supernatants (2 mL) were mixed with 4 mL of thiobarbituric-trichloroacetitic acid solution. The homogenates were then heated in a water bath at 90°C for 30 min and cooled. Subsequently, 300 μL of the supernatant was placed into a microplate, and the absorbance was measured at 532 nm using a spectrophotometer (X-ma 3100, Human, Gwangju, Korea).
Mackerel fillets were weighed before and after storage. The samples were wiped using a clean tissue before weighing. Drip loss was determined as the percentage ratio of the removed weight to the initial weight of the sample.
Three grams of each sample were distributed into an aluminum dish. The samples were then oven dried at 110°C for 16 h. The difference in weight before and after oven drying was recorded as a percentage.
Color parameters were measured using a colorimeter (CR-400 Chroma Meter, Konica Minolta, Osaka, Japan) calibrated with a white standard plate (International Commission of Illumination; CIE L*=96.79, CIE a*=0.30, and CIE b*=1.67). The surfaces of the samples were analyzed six times. There were two types of muscles measured for color: dark muscles, characterized by brown or reddish tissue on the flesh from the presence of myoglobin pigmentation, and white muscles, which exhibited white to off-white tissue on the flesh due to the lower levels of myoglobin. The results were presented as CIE L*, CIE a*, and CIE b*.
The texture profile was analyzed using a TA1 texture analyzer (AMETEK Lloyd Instruments, Fareham, UK). Ten grams of ground sample was placed into a petri dish (35×10 mm2), cooked in a laboratory water bath at 80°C for 20 min, and cooled. A compression plate of Ø 70 mm was attached to the analyzer that compressed the samples twice (test speed of 2 mm/s, maximum cell load 50 kg, compression level 60%, and trigger force of 0.1 N). The data were analyzed using the NexygenPlus software program (AMETEK Lloyd Instruments) with the following parameters: hardness (N) represents the maximum force required to compress the sample; springiness (mm) refers to the duration ability of the sample to recover its original form after a deforming force has been removed; chewiness (N) is the work required to chew or crunch the sample for swallowing; cohesiveness (N) indicates the extent of total energy required to which the sample can be deformed prior to rupture; adhesiveness (kgf.mm) is the work necessary to pull the compressing plunger away from the sample, represented by the negative area under the baseline between the compression cycles; elasticity represents the ability of sample to regain its original shape or structure after deformation or compression, and gumminess (N) indicates the force necessary to disintegrate a semi-solid sample for swallowing (Bourne, 2002).
SEM was conducted according to the method described by Andrés et al. (2006), with some modifications. The sample (0.5×0.4×0.3 cm3) was fixed with Carnoy’s solution at 4°C for 24 h. The samples were then dehydrated using ethyl alcohol and immersed in hexamethyldisilazane for 10 min. The dried sample was mounted on an aluminum stub with carbon tape. It was then thinly coated with platinum under vacuum pressure (EM ACE200, Leica, Wetzlar, Germany). The samples were observed under a field-emission SEM (SUPRA 55VP, Carl Zeiss, Oberkochen, Germany).
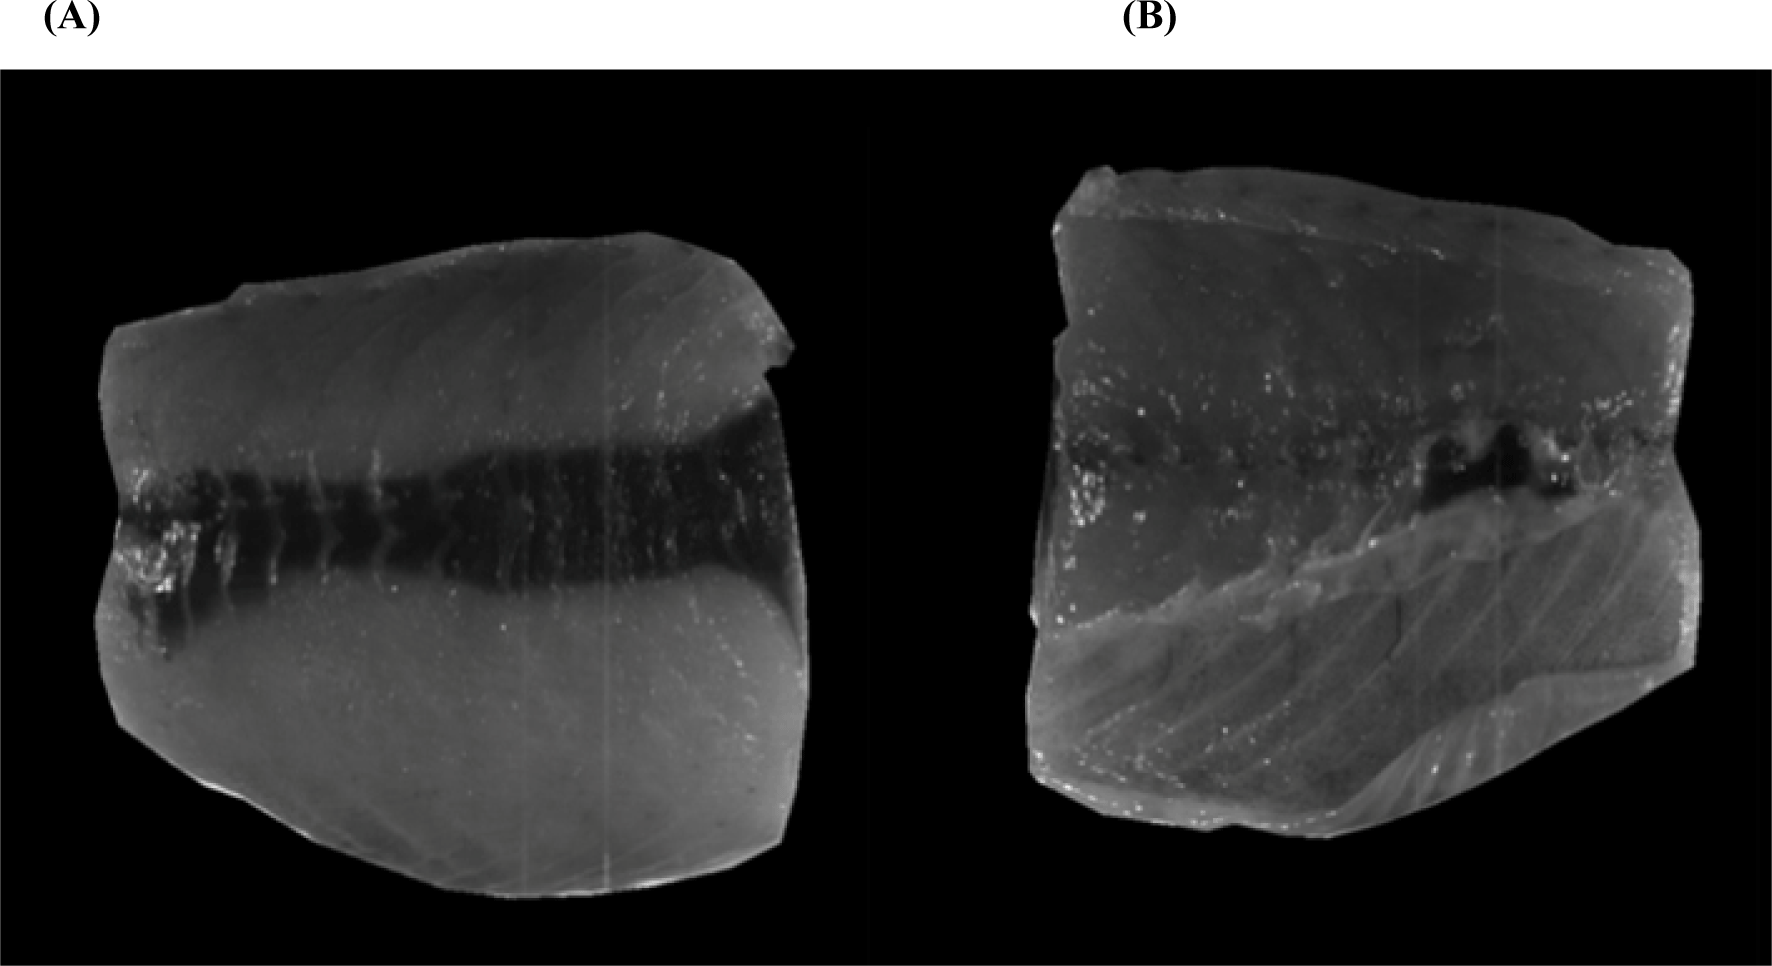
HSI analysis was performed using a push broom scanner with an HSI-200 sensor (Korea Spectral Products, Seoul, Korea). Each pixel of an image consisted of 640 wavelengths of the spectrum covering the wavelength region from 400 to 1,700 nm. Ninety-six samples of mackerel fillets were observed using HSI, which indicates two sides of the fillets; inside (Fig. 1A) and outside (Fig. 1B). However, the average data was tabulated at only inside of the fish fillets to obtain a better predict information with less variation in each region of interest (RoI). HSI was equipped with an imaging spectrometer with a resolution of 640 spectral x 512 spatial generated using a InGaAs PIN-Photodiode hyperspectral camera in the spectral range of visible and short-wave near-infrared regions.
The white reference was acquired using a Teflon whiteboard (99.99% reflectivity), and the dark reference was acquired by covering the camera (0% reflectance). This was done to eliminate the dark current effect and reduce the influence of uneven illumination, resulting in small ranged from 0 to 1. Normalized reflectance data were calculated using Eq. (1). After constructing the reflectance data, each spectrum included in the RoI of the same sample was averaged into a single spectrum for analysis.
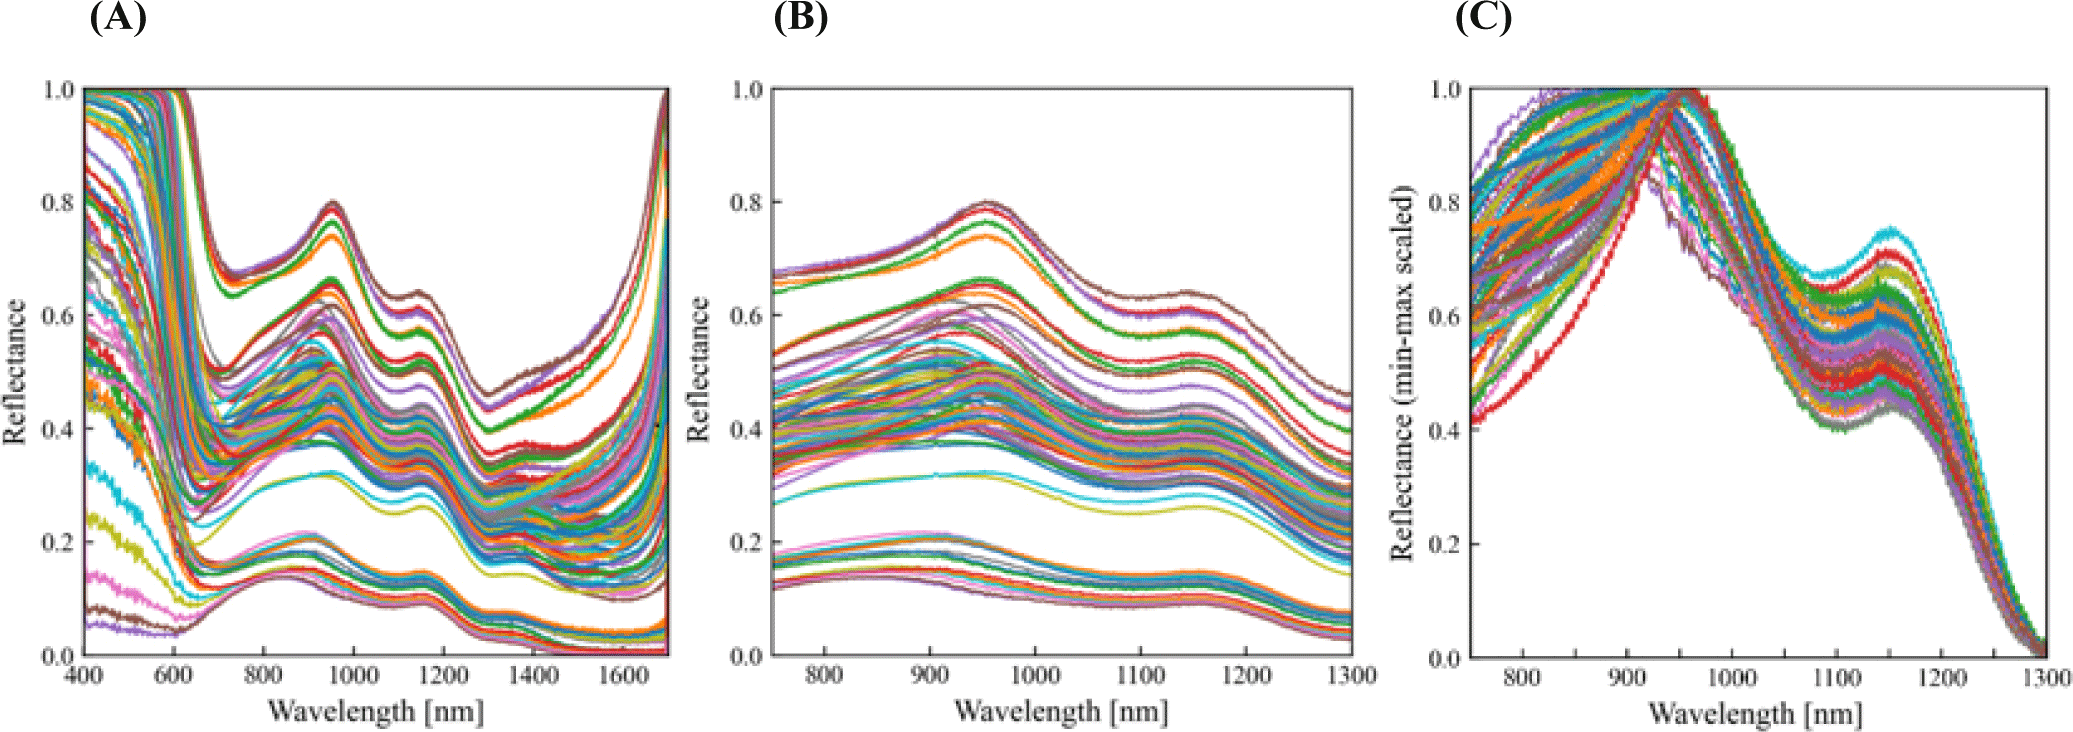
To minimize the noise from the raw reflectance data, only the spectra from 750 to 1,300 nm were used for the analysis. To remove unnecessary baseline drifts among the signals, all signals were scaled into the range of 0 to 1 (min-max normalization). The reflectance spectra were recorded by indicating the raw data and signals after pre-processing.
Partial least square (PLS) was used to construct data for analysis and modelling. A comparison was made between the hyperspectral data and twenty-eight different quality parameters of mackerel fillets (n=96), which revealed that 17 of these parameters yielded reliable results.
To enhance data processing performance, the leave-one-out cross-validation method was employed for calibration and validation of the PLS models according to the method by Xu et al. (2018). The optimal number of PLS components (N) for each quality parameter was determined based on the lowest value of the root-mean-square error estimated by cross-validation (RMSECV).
Data were analyzed by one-way ANOVA and Tukey’s test at a significance level of 95% using SAS 9.4 program (SAS Institute, Cary, NC, USA). Data are presented as mean (n=3) and standard error of the mean. The PLS and principal component analysis (PCA) models of the entire HSI dataset of mackerel fillets (n=96) were implemented in Python version 3.7.9 (Python Software Foundation, Beaverton, OR, USA).
Results and Discussion
The FTR group showed significantly the lowest drip loss among the treatments on days 1 and 6 (Table 1). Significant water loss in the muscle and is lethal to bacterial growth due to the ice crystal formation (Cropotova et al., 2019; Tan et al., 2021). On day 1, drip loss was the highest in the FTW group (2.77%) compared to the other groups (0.51%–1.32%; p<0.05). Water content and pH are the major post-mortem changes in fish muscle due to the water loss or exudation occurring during muscle stiffening. These changes lead to an increase in rigidity, reaching a maximum level after 12 to 24 hours (Chan et al., 2020). Temperature abuse during the thawing process leads to rapid changes in the water content of a previously frozen condition (Negara et al., 2021). The water content in group A increased within three days and then dropped on day 6 (p>0.05). Group A was exposed to ambient temperature, which caused muscle contraction and resulted in higher water content compared to other storage methods during three days of storage. Relative humidity of storage was fixed at 40% in all storage methods.
Theoretically, an increase in pH reflects an increase in the water content in the muscle protein via charge shielding (Brewer, 2014). However, no significant difference in pH was observed among the groups. When the autolytic processes were initiated, quality deterioration also started due to a favorable environment for bacterial growth (Duarte et al., 2020). Among the different groups, group I had the lowest pH (6.61) at 3 d and the highest pH on day 6 (6.14; p>0.05). This might be due to the effects of temperature on extracellular proteolysis and the increase in pH caused by bacterial accumulation (Toe et al., 2019). The increase in pH on day 3 may be due to post-rigor changes (Matarneh et al., 2017). The sudden decrease in pH on day 6 was due to the break down of muscle glycogen, producing lactic acid, which caused acidification and post-mortem softening of fish flesh (Liu et al., 2013; Singh and Benjakul, 2018).
Color represents the constituents of several compounds in muscle tissues. For instance, dark muscles have more prominent fat and myoglobin content than white muscles because of the higher amount of lipid droplets and myofibrillar protein in the tissues (Listrat et al., 2016). Table 2 shows the comparison of dark and white muscles in fish fillets stored using different methods. For CIE L*, no significant difference was found in dark muscles, except in the FTW group. The frozen mackerel was appeared to be darker after water thawing owing to water loss and destruction of the microstructure (Zhang et al., 2021). Zhou and Xie (2021) agreed that fish had better CIE L* after thawing in the refrigerator and temperature rise resulted in the worst color values because of protein denaturation.
CIE a* of muscle tissues is primarily influenced by the pigmentation of myoglobin (Greer, 2020). The FTR and FTW groups had lower CIE a* in the dark muscles compared to the other storage groups, which turned the fillets into purple-red due to deoxygenation, freezer burn, or abnormally long storage (Wang and Xie, 2020). In the white muscle, the CIE a* were contradictory to those of the dark muscle. This might be due to the low myoglobin content in the muscle, which affects color values (Listrat et al., 2016). The CIE b* in the dark muscle of fish fillets increased on day 6, except in the FTW and FTR samples, because the freezing condition produced a low TBARS value. The increase in CIE b* of fish fillets is influenced by the escalation of lipid oxidation, which can be assessed using TBARS. This process leads to the generation of reactive oxygen species and accumulation of oxidation products, eventually leading to discoloration and a tougher texture in the muscle tissue (Sriket and La-ongnual, 2018). The results also proved that the FTR and FTW groups had significantly higher hue angles in the dark muscle than the other groups on day 6, which conformed to the relationship between the CIE a* and CIE b* of fish fillets.
As shown in Fig. 2A, the TBC of mackerel fillets was initially 1.80 Log CFU/g and was significantly higher in group A than in the other groups. Ambient temperature is a favorable environment for microorganism growth and activity (Lee et al., 2014). Theoretically, an increase in microorganism growth simultaneously decreases freshness and initiates spoilage (Mohammed et al., 2021). On day 6, all storage methods were below the acceptable limit of TBC in fish, which was 7 Log CFU/g (ICMSF, 1986; Nayma et al., 2020). However, the A group was not suitable for consumption starting from day 6 due to rapid spoilage, unpleasant odor, and unfavorable quality traits. The FTR group had the lowest TBC during the entire storage period. This is because freezing caused slow growth and/or inactivation of bacteria (Mohammed et al., 2021).
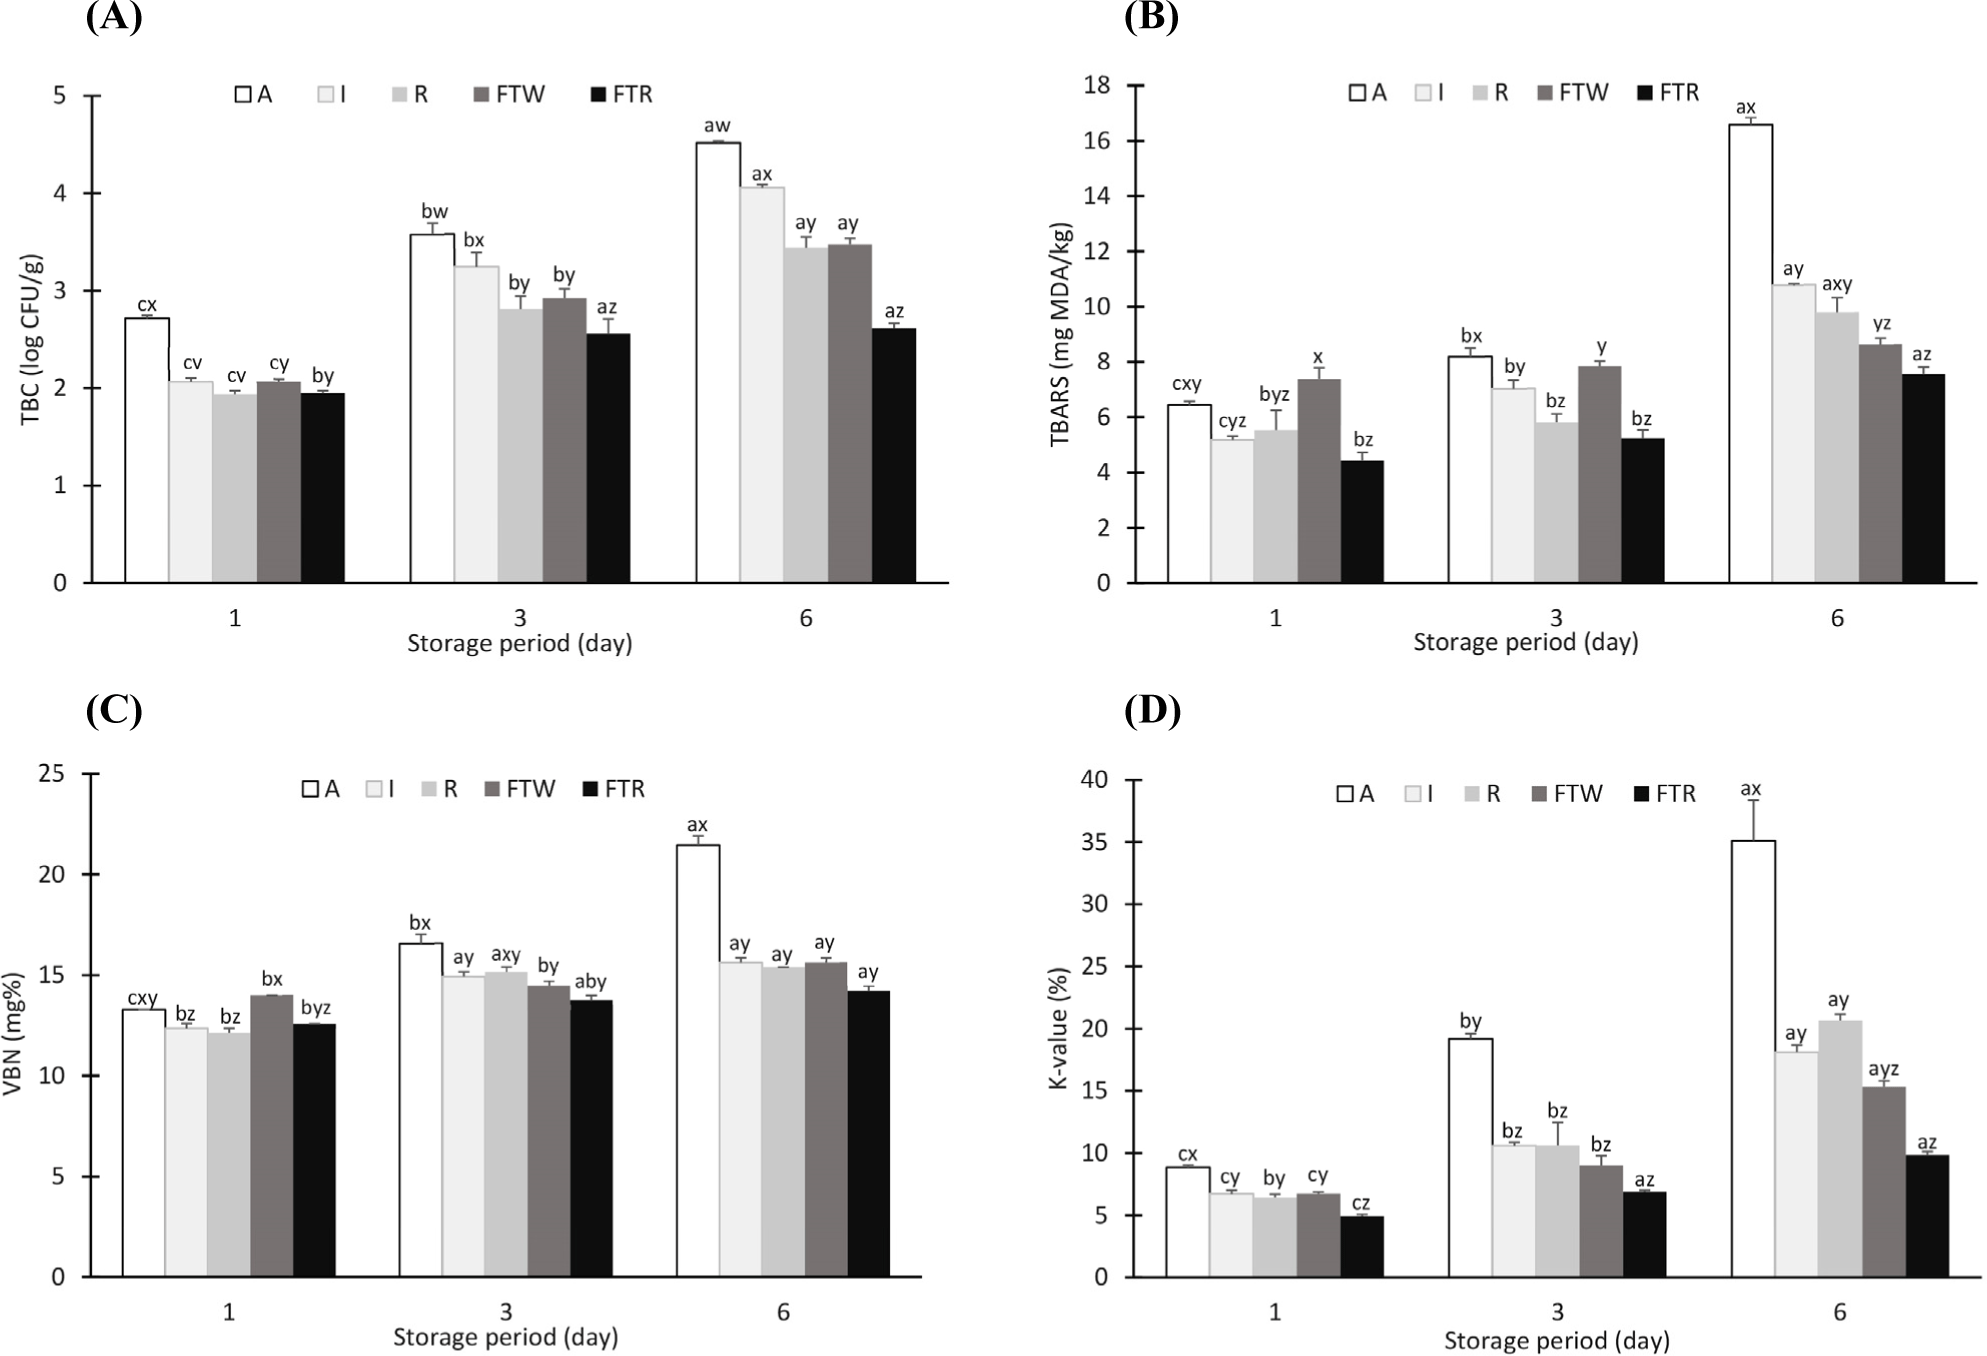
Slow lipid oxidation primarily resulting in the formation of hydroperoxide is attributed to the low temperature, which subsequently leads to a gradual increase in lipid autolysis and enzymatic activity in fatty fish (Duarte et al., 2020). Mackerel muscle is highly susceptible to lipid and protein oxidation due to its low post-mortem pH, high polyunsaturated fatty acid content, and abundance of pro-oxidants (Sone et al., 2020). Lipids readily decompose into low-molecular-weight volatile compounds such as aldehydes and ketones, producing unpleasant odors (Domínguez et al., 2019). The initial TBARS value of the mackerel fillets was 3.40 mg malondialdehyde (MDA)/kg. On day 1, the FTW group had the highest TBARS value (7.38 mgMDA/kg) compared to other groups (p<0.05) as sown in Fig. 2B, because thawing in water triggered rapid lipid oxidation (Wang and Xie, 2020). However, on day 6, TBARS values were the highest in group A (16.59 mgMDA/kg), followed by I, R, FTW, and FTR groups (p<0.05). Ambient temperature can cause massive lipid degradation and peroxidation compared to low temperatures (Domínguez et al., 2019). The FTR group had the lowest TBARS values (4.44–7.56 mgMDA/kg) during the storage period because freezing conditions favored higher disulfide bond content and surface hydrophobicity (Li et al., 2020; Sriket and La-ongnual, 2018).
As stated by Li et al. (2020), decreased enzymatic activity and minimal oxidative reactions during freezing affected the VBN content. The initial VBN value of the samples was 9.10 mg% and it increased linearly with storage time. The FTR group had the lowest VBN values among the different groups (p<0.05; Fig. 2C). This is because muscle protein undergoes slow denaturation during storage due to the slow enzymatic reaction, leading to a decrease in soluble proteins (Cropotova et al., 2019). K-value is a parameter based on nucleotide pathways and is used as an indicator of fish flesh freshness. The K-value of mackerel fillets was 8.99% on day 0 and increased continually over the storage period due to the rapid degradation of proteins and lipids. Fish is considered fresh when the K-value is less than 20%, while it is considered spoilt when the K-value exceeds 60% and sensory rejection is initiated at 63% (Mohan et al., 2009; Mohan et al., 2019). Group A had the highest K-value, whereas the FTR samples showed the lowest value during storage (p<0.05; Fig. 2D). This finding was similar to that of previous studies where storage at ambient temperature for 6 h elevated the K-values for mullet and pearl spot fishes (Lakshmanan et al., 1996). Turbot stored in cold storage (slurry ice) had a lower K-value than those stored in flake ice (Rodríguez et al., 2006). Tuckey et al. (2010) found justified that the K-value of fish fillets rose rapidly from 19.27% to 52.11% when stored at 15°C for 36 h.
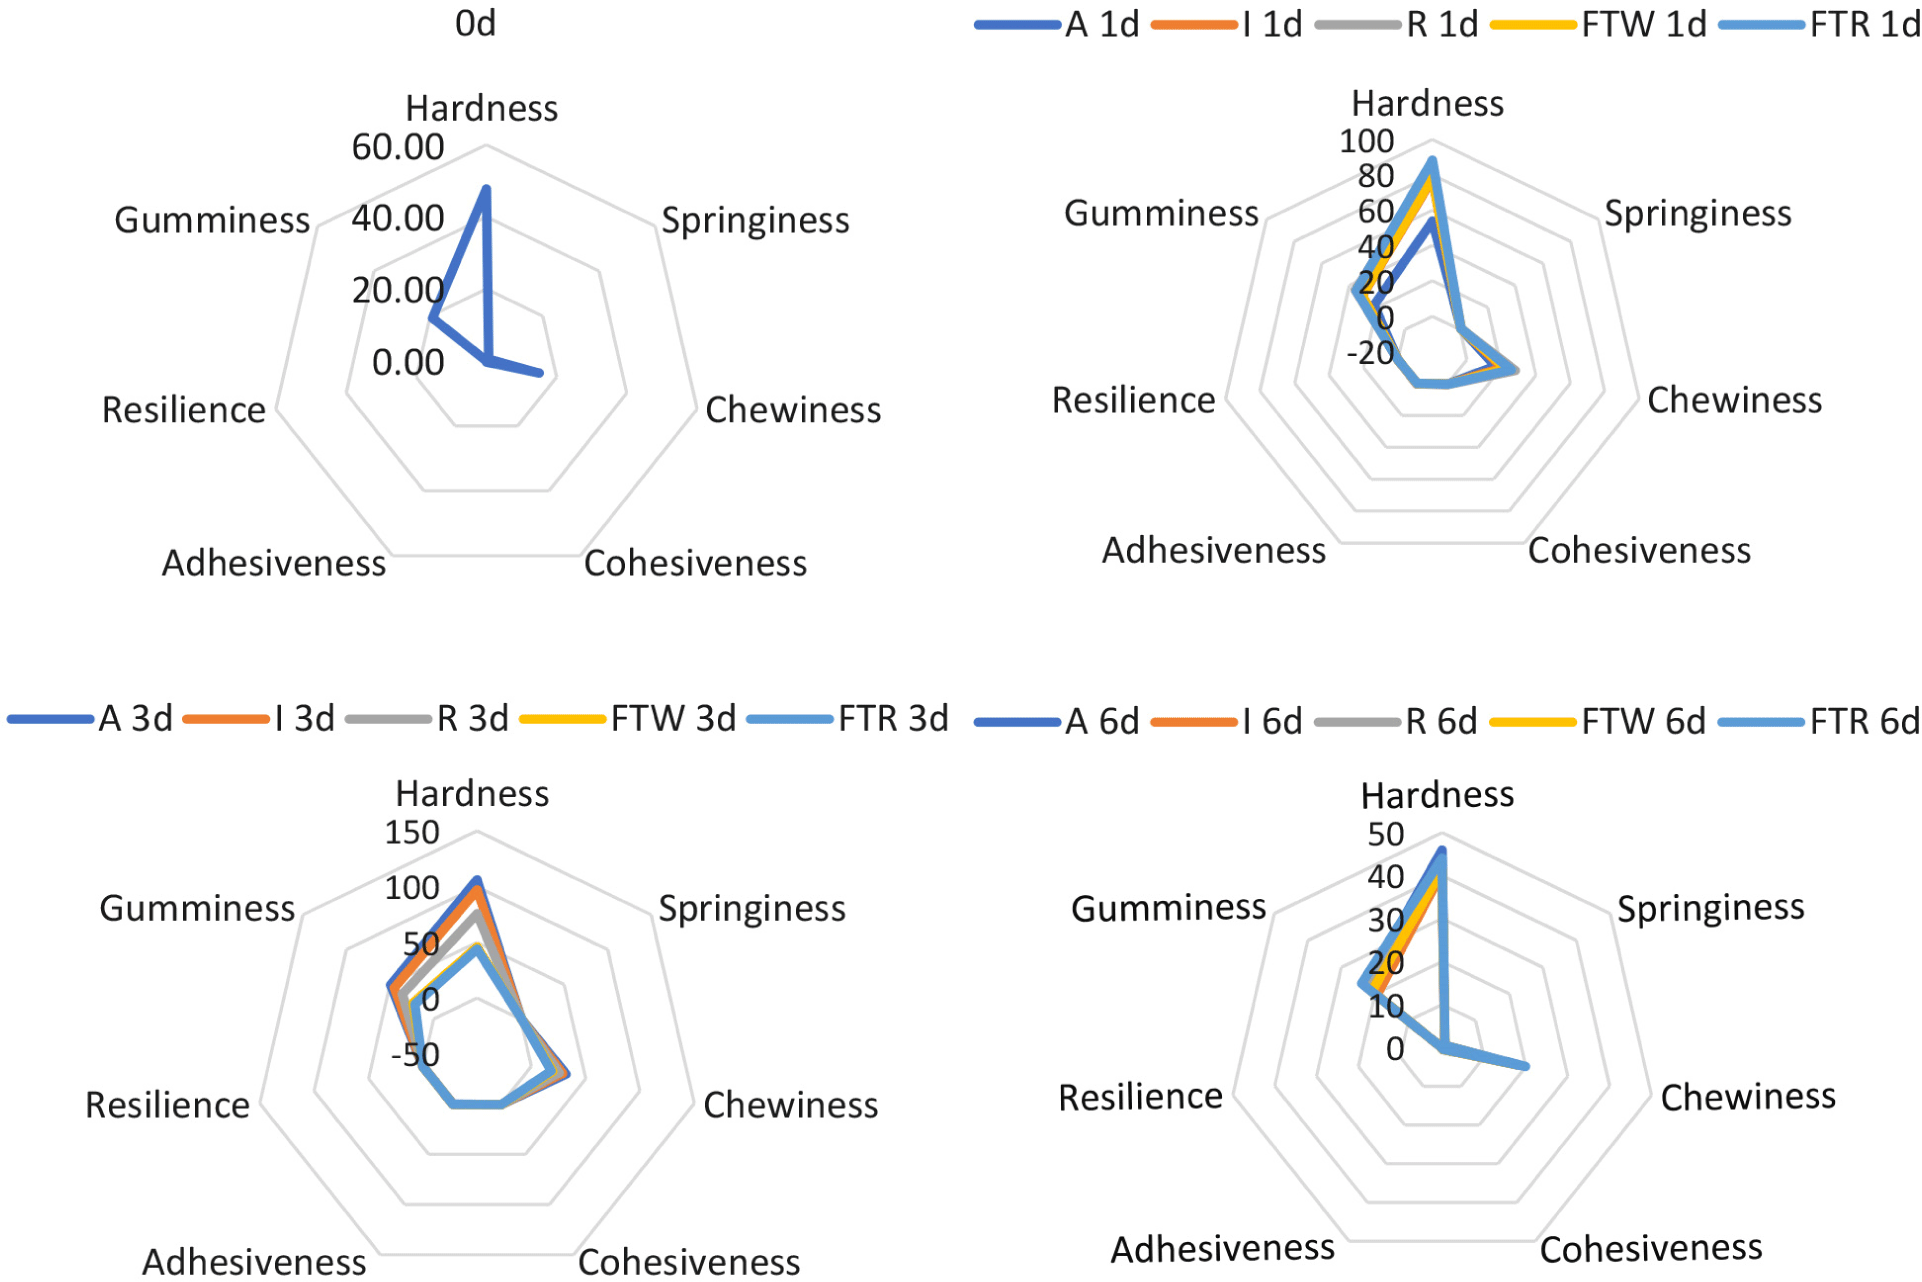
Textural properties of mackerel fillets stored under different conditions was illustrated in Fig. 3. In general, fish fillets with higher pH have higher water activity, softness, and juiciness (Sun et al., 2018). The decrease in tenderness occurs because of the synergistic effect of numerous endogenous proteolytic systems (Kaur et al., 2021). On day 6, the FTR group showed a hardness and chewiness of 44.06 N and 18.14 N, respectively, which was slightly lower than those (hardness=45.83 N; chewiness=19.57 N) in the FTW group (p>0.05). However, the hardness and chewiness of fish fillets in both FTR and FTW groups were significantly lower than those in the other groups, which might be due to microbial proteolysis activity (Matarneh et al., 2017). On day 6, the FTR group had the highest springiness (0.84 mm) among the different storage groups (0.80–0.83 mm; p>0.05). Hardness and springiness are common textural indicators of fish freshness, resulting from protein denaturation (Bourne, 2002). Besides, on day 6, the FTR group had the lowest adhesiveness (0.14 kgf.mm) among the different groups (0.17–0.23 kgf.mm). The elasticity increased over the storage period, and on day 6, the FTR group had the highest elasticity (0.03–0.05 Pa) among the different groups. Slower proteolysis due to the low temperature caused fewer changes in protein linkages, maintaining the textural properties (Cropotova et al., 2019).
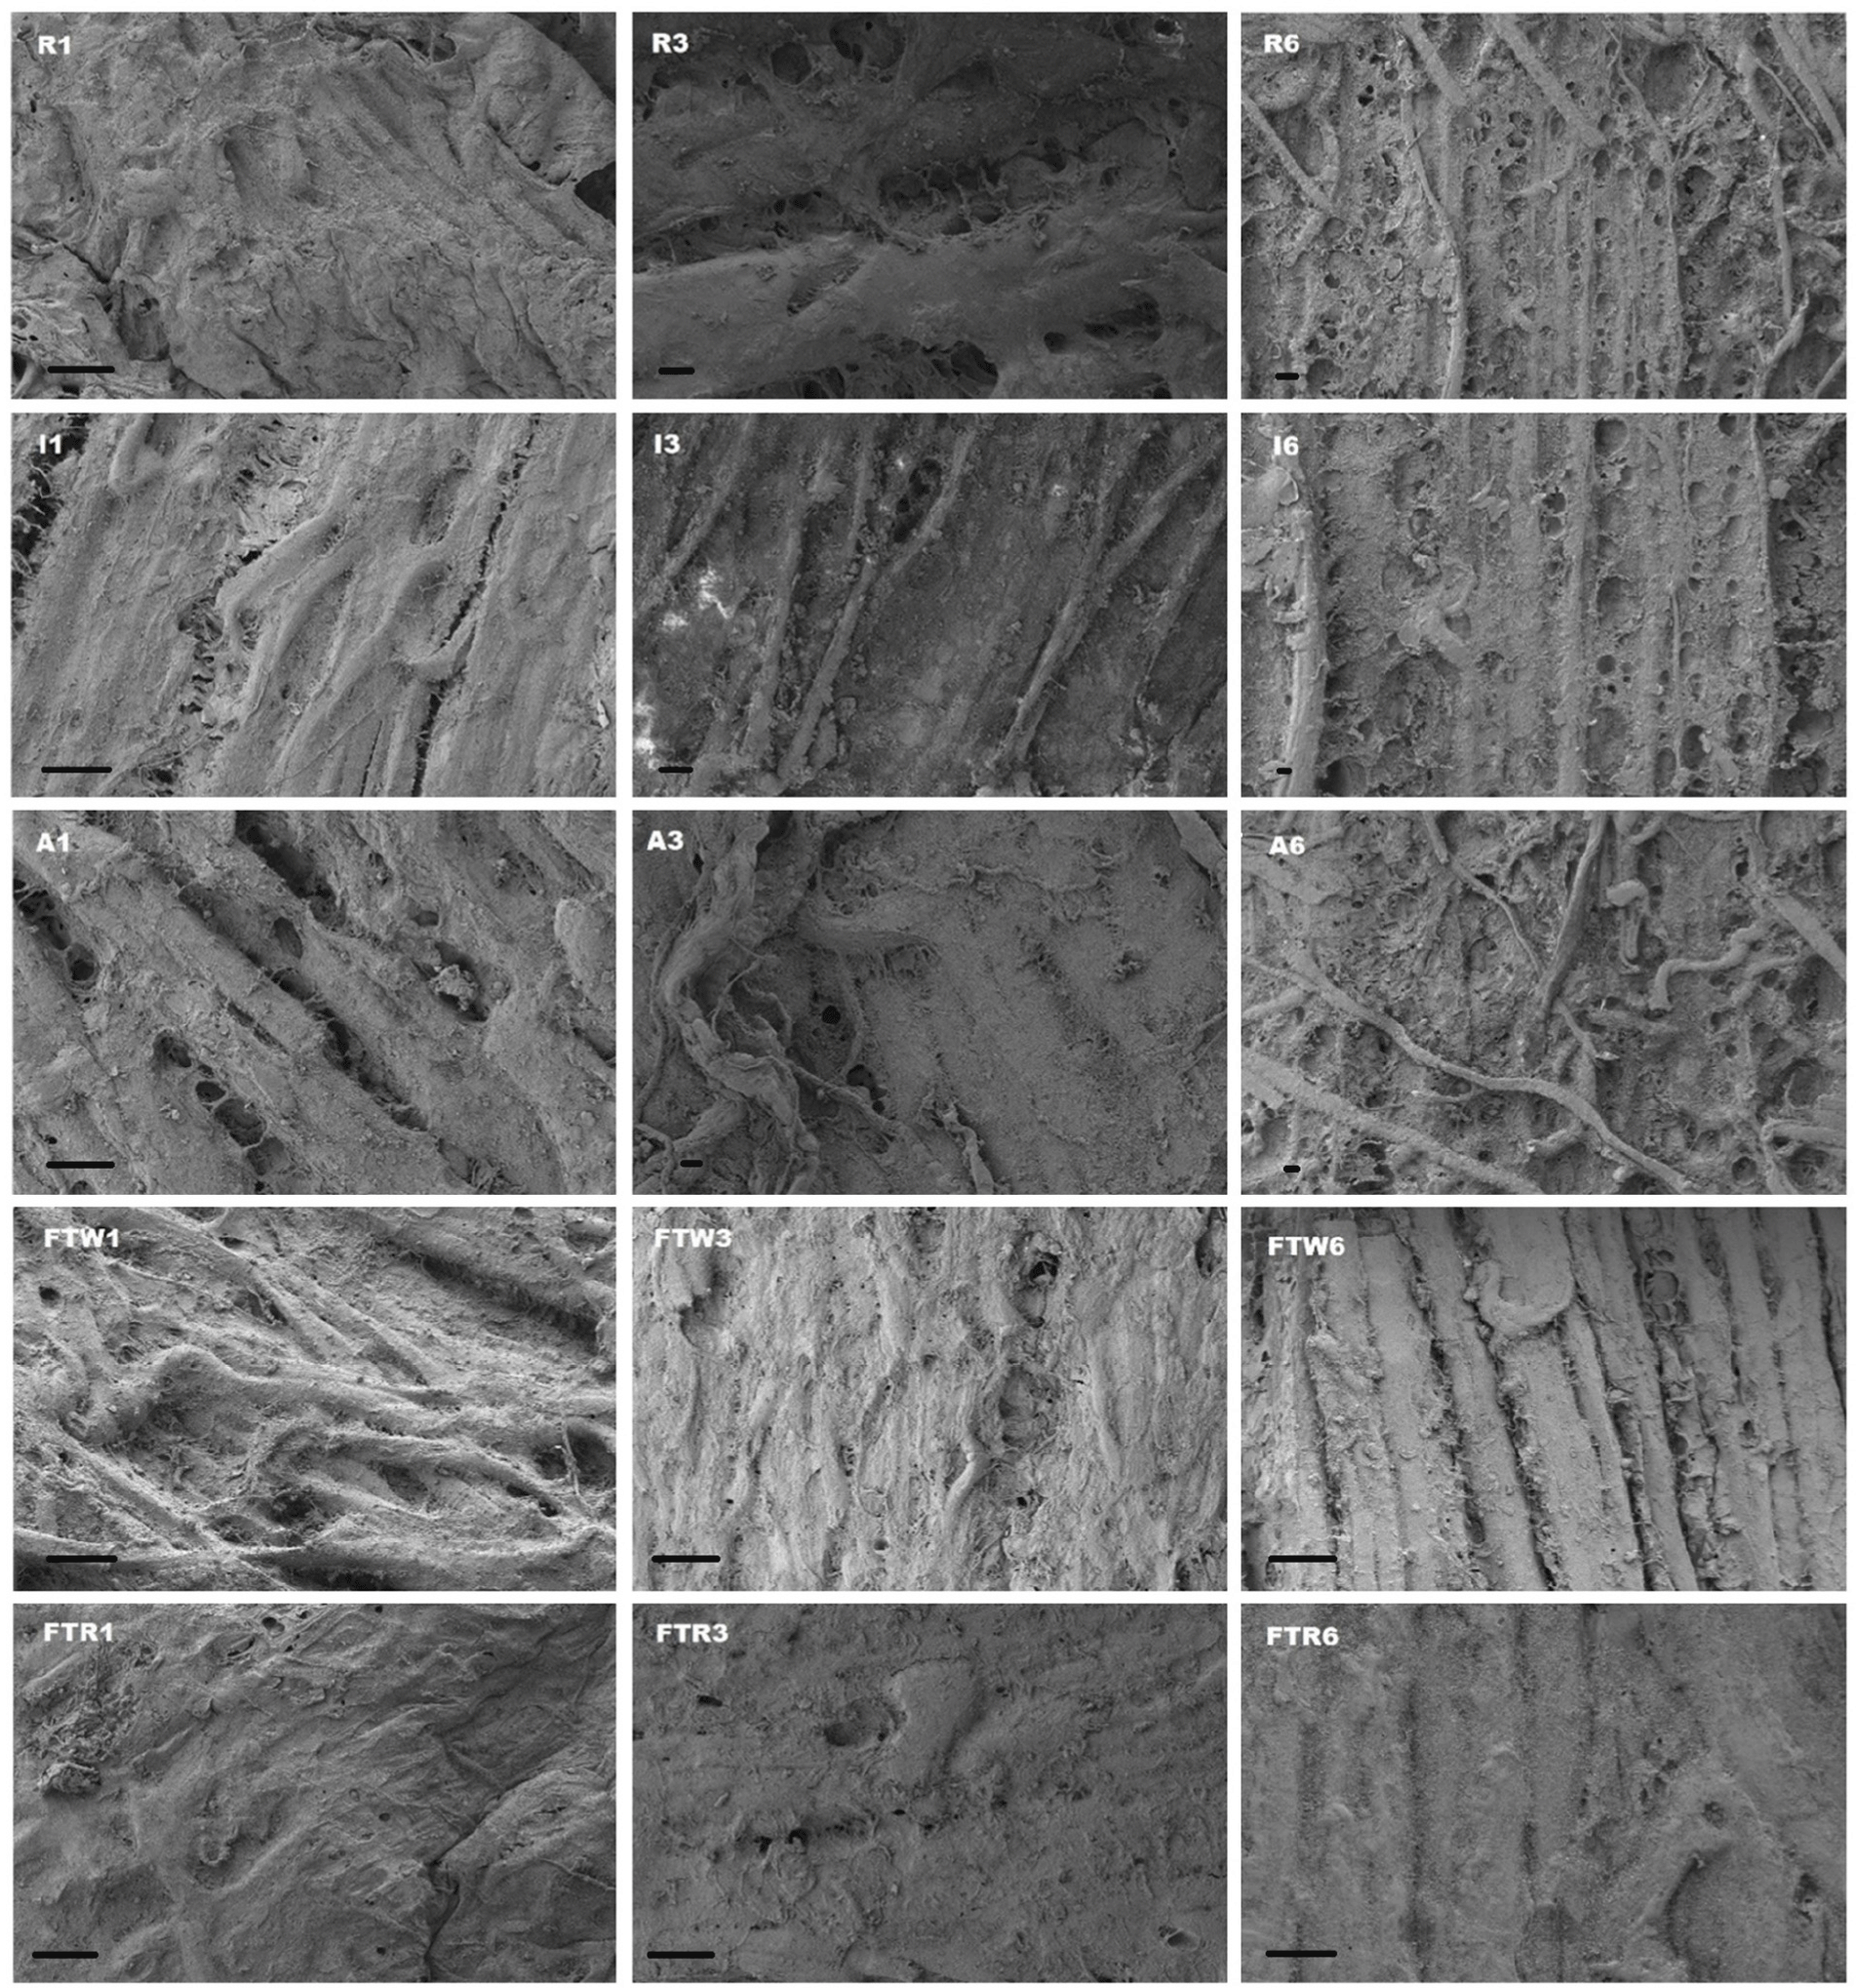
The SEM images of the mackerel fillets stored under different conditions are shown in Fig. 4. Moist environment produces narrowed muscle tissues due to strong muscle contraction (Wang and Xie, 2020). Muscle tissues in mackerel fillets were slightly narrowed in the I and FTW groups on day 1 and were narrower, with more tissue damage on days 3 and 6 compared to the other groups. Shrinkage of muscle tissues at cold temperatures was also observed by Cropotova et al. (2019). The muscle tissues in the FTR group were smooth and elongated, while those in other groups shrunk. SEM observations revealed that group A showed severe structural destruction from day 1 onwards due to high temperature, moist environment, and large muscle contraction (Sigholt et al., 1997). Over the storage period, group I showed less muscle destruction than group A but more muscle destruction than groups FTR and FTW.
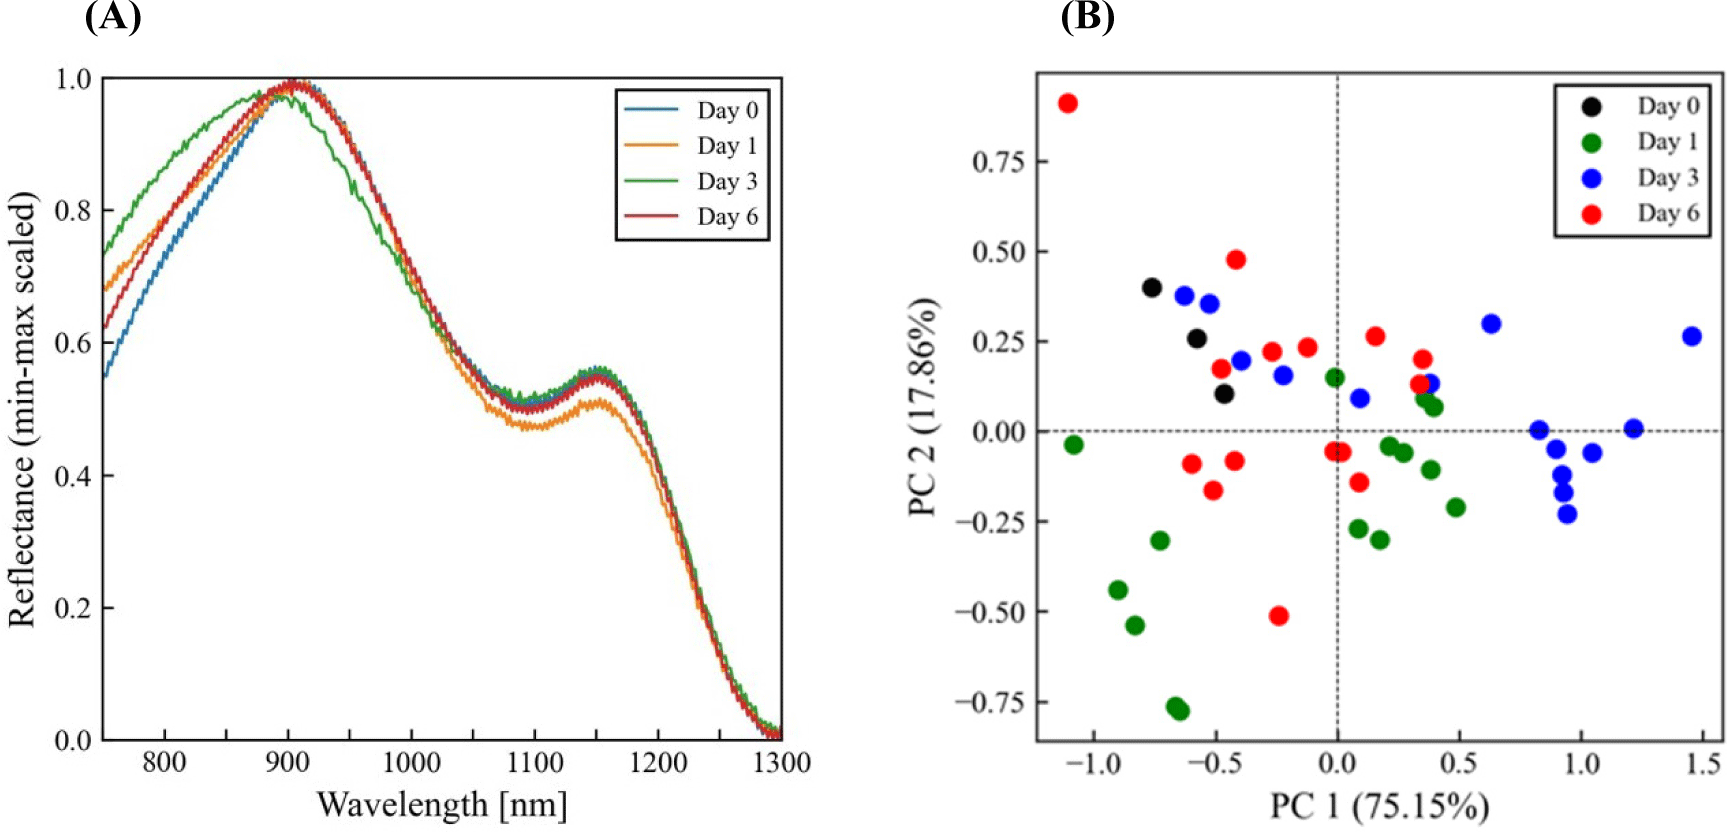
The reflectance spectra before (Fig. 5A) and after pre-processing using wavelength selection (Fig. 5B) and then underwent minimum-maximum normalization (Fig. 5C) were illustrated. Based on the Fig. 6A, it appears that the presence of first and second overtone peaks at 950 and 1,160 nm, respectively, suggests that there are molecular vibrations occurring in the sample that could be associated with O-H stretching bonds by moisture or sulfmyoglobin oxidation (Chen et al., 2021; Khoshnoudi-Nia and Moosavi-Nasab, 2019). Score plots with respect to storage period were used as the reference dataset for PCA as described in Fig. 6B. Spectral data on the quality parameters of the mackerel fillets were obtained using HSI coupled with a PLS-based regression model, as shown in Table 3. PLS showed a relatively high correlation coefficient (R2c=0.54–0.96), which is in agreement with previous studies on muscle foods (Chen et al., 2021; Wu et al., 2016; Xiong et al., 2015; Xu et al., 2016).
N, latent variables; R2C, coefficient of calibration; R2cv, coefficient of cross-validation; RMSEC, root-mean-square errors estimated by calibration; RMSECV, root-mean-square errors estimated by cross-validation; RPDCV, relative percent difference of cross-validation; TBARS, 2-thioabarbituric acid reactive substances; VBN, volatile basic nitrogen; H, hue angle.
The performance of each chemometric model was attributed to the number of samples and variables, type of samples, wavelength range, waveband selection method, and optimal multivariate analysis (Moosavi-Nasab et al., 2021). From the results, 10 of the 17 quality parameters showed good coefficient of correlation in cross-validation values (R2cv°C0.31). The remaining had acceptable positive values of R2cv. However, there is no limitation or acceptable value for R2 because this value can be improved by modifying the statistical model for the best performance (Temiz and Ulaş, 2021).
The spectral properties of meat change with pH due to changes in the chemical composition and stretching vibrations of the muscle foods (He et al., 2014). The pH model in this study indicated the highest correlation coefficients for both R2cv and R2c (coefficient of calibration), which were 0.86 and 0.96, respectively, with high PLS components (N=11). For instance, the R2c of pH in Atlantic salmon, determined by He et al. (2014), were 0.87 (R2cv) and 0.89 (R2c), which are slightly similar to the current results. Wang et al. (2019) found that the correlation coefficients of pH in crucian carp were 0.72 (R2cv) and 0.87 (R2c). In the present study, VBN obtained using the PLS model had R2c=0.87, which was relatively similar to that obtained in other fish fillet studies using PLS and multiple linear regression (MLR; R2c=0.76–0.89) and backpropagation – artificial neural network (BP-ANN; R2c=0.88; Cheng et al., 2015; Khoshnoudi-Nia and Moosavi-Nasab, 2019; Moosavi-Nasab et al., 2021; Wang et al., 2019).
The TBARS and K-value were also evaluated using the PLS model. Cheng et al. (2016) found more feasible to use PLS, multispectral imaging (MLR), least square-sector vector machine (LS-SVM), genetic algorithms, and successive projection algorithm (SPA) with R2cv=0.76–0.83. However, the present TBARS values had a slightly lower R2cv value (0.64) than aforementioned studies. The TBARS value of frozen-thawed pork was higher when using SPA-PLS (R2cv=0.80; Wu et al., 2016), while that of chicken meat was higher when using the PLS model (R2cv=0.87; Xiong et al., 2015). In this study, the K-value was determined at R2cv=0.48, using the PLS model. Cheng et al. (2015) and Cheng et al. (2016) found that the R2cv of the K-value in fish fillets was 0.94 using the PLS and LS-SVM models, whereas was 0.95 using the MLR model.
Conclusion
The HSI and conventional analyses revealed that mackerel fillets stored under FTR conditions were the freshest, with minimal impact on physicochemical traits, compared to those kept under other storage conditions. This valuable information had a greater impact on the seafood industry for practical implementation in the short-chain supply before reaching consumers. Interestingly, thawing in the refrigerator was recommended in this study compared to thawing in tap water. The quality of the fish fluctuated with increasing temperature and storage period. The results showed that group A was inappropriate for storing fish fillets. Furthermore, the freshness of the fish fillets in group I was much lower than that of those in the R, FTW, and FTR groups starting from day 3.
The HSI, coupled with the PLS model, yielded positive results for the quality parameters of fish, particularly pH, TBARS, VBN, K-value, and texture. Consequently, the HSI system could replace the conventional method for evaluating the quality of fish fillets, reducing analysis time and costs. These findings provided valuable insights into the potential and effectiveness of using HSI in fundamental applications within the seafood industry. A comprehensive understanding of storage design for fish fillets could enable the industry to employ the best methods for maintaining fish quality.
The practical application in these studies undoubtedly offers significant knowledge to the seafood industry regarding the storage of fish fillets and the use of HSI as a non-destructive quality measurement tool. The HSI results for quality parameters using the PLS model could be improved by employing reliable multivariate analyses to achieve higher correlation coefficients and accuracy compared to the presented results. Further studies measuring metabolite contents in fish fillets using the HSI system are recommended to confirm its effectiveness and efficiency in analyzing low-molecular-weight compounds.


